
Evaluation of Geometric Deviations and Uncertainties Between 2D Facility Management Drawings and 3D LiDAR Scans for Urban Microclimate CFD Simulations
ⓒ 2026. KIEAE all rights reserved.
Abstract
While the geometric precision of building models is critical in microclimate computational fluid dynamics (CFD) simulations, the reliance on two-dimensional (2D) facility management (FM) drawings, which often lack exterior finish details, remains a prevalent practice. This study quantitatively analyzed the geometric deviation between 2D FM drawings and three-dimensional (3D) light detection and ranging (LiDAR) scan data of an aging large-scale building to examine the inherent uncertainties of both datasets.
Using a LiDAR-based Scan-to-Plan approach, the as-is 2D exterior contour was extracted, and a Python-based centroid auto-alignment with a KD-Tree algorithm was applied to mathematically quantify deviations based on 15,224 precisely matched points. The measurement, registration, and extraction uncertainties of the scanning pipeline were further incorporated into an error budget to distinguish scan-induced error from actual form differences.
The analysis revealed a mean bias error (MBE) of +0.1160m, empirically demonstrating a systematic outward offset caused by the omission of exterior finishing materials, while the 95th percentile error (P95) reached +0.6130m and only 13.91% of the data points fell within the acceptable construction tolerance (±30mm). The error budget confirmed that the observed deviation predominantly reflected real geometric differences–omitted finish thickness and post-construction deformation–rather than scan noise or human error. By cross-examining the volume underestimation of drawing-based models and morphological overrepresentation of LiDAR scan data, this study highlights the necessity of recognizing geometric gaps and carefully calibrating the data according to the simulation objectives.
Keywords:
Microclimate Simulation, Computational Fluid Dynamics (CFD), 3D LiDAR Scanning, Geometric Deviation, Uncertainty1. Introduction
1.1. Background and Necessity of Study
Recently, as urban microclimate issues such as the urban heat island effect and building-induced wind phenomena have become increasingly important due to climate change, evaluations of pedestrian wind environments and thermal comfort around buildings using computational fluid dynamics (CFD) have been actively conducted [1,2]. In precision environmental simulations based on digital twins, the geometric shape of the three-dimensional (3D) model of the building under analysis is one of the most critical boundary conditions governing the airflow and surface convective heat transfer [3,4]. In particular, as the green remodeling of aging buildings and improvement of energy and thermal environment performance have emerged as national tasks, obtaining accurate geometric information about existing buildings has become a prerequisite for reliable environmental performance evaluation.
When performing 3D modeling on existing buildings, existing practice has generally involved simply extruding the planar lines of the previously established two-dimensional (2D) maintenance drawings to create the shape, due to practical convenience and ease of data acquisition [5,6]. However, academic verification of how accurately these drawing-based 3D models represent the actual built environment is still lacking [7,8].
1.2. Limitations of Conventional 2D Drawing-Based 3D Modeling
Most conventional facility management (FM) drawings are created to represent the original design intent, with the structural framework serving as the backbone of the building [8]. As a result, it is common for the physical thickness of insulation and exterior finishing materials, such as stone, glass, and metal panels, attached during construction or remodeling to be omitted from the drawings. Moreover, in the case of large, aging buildings that have been completed for a long time, the tolerances or long-term structural deformations that occurred during construction have not been reflected in the current drawings [8,10]. These morphological distortions of the building exterior walls and omission of finishing material thickness are not just visual differences; they can cause severe physical distortions to surface roughness, friction resistance, flow separation, and vortex formation where airflow collides with the building surface [11,12]. Therefore, if an ideal 3D model that entirely relies on a 2D drawing with the volume of the exterior finishing material omitted is directly applied to precise environmental simulations, it can lead to an underestimation of the airflow path and shielding effects, resulting in errors in predicting airflow and thermal environment patterns [12,13]. On the other hand, even if 3D light detection and ranging (LiDAR) scanning techniques are introduced to replace this, other geometric uncertainties inevitably accompany it, such as scan noise present in the acquired point cloud data and human errors introduced during the reverse engineering (Scan-to-Plan) process.
1.3. Purpose of Study and Structure of Paper
The purpose of this study is to quantify and analyze the geometric deviations in the exterior walls of conventional 2D FM drawings in millimeters (mm) based on high-precision point cloud data of actual buildings obtained through 3D laser scanning (LiDAR) technology. This study empirically demonstrates the limitations of the thickness bias of finishing materials and local shape distortions missing in conventional drawings, while also examining the characteristics of extraction errors and irregularities inherent in the scan data. Furthermore, this study quantitatively evaluates the uncertainties inherent in the measurement, registration, and extraction stages of the scan data in the form of an error budget, thereby demonstrating that the observed deviations are primarily due to actual shape differences rather than measurement errors. Ultimately, in performing precise microclimate analysis, avoiding biasing toward one side of the data and clearly recognizing the inherent limitations and potential for errors in each dataset are recommended, using them judiciously according to their intended purpose. This study was conducted by selecting large, aging buildings with distinct surface irregularities and morphological characteristics as the subject of the research. We introduced a Python-based centroid matching algorithm and K-dimensional tree (KD tree) spatial search technique to automate the precise coordinate alignment and error computation between heterogeneous data. In particular, based on the 15,224 precise matching point data extracted through the discretization process of dividing the 2D contours of the two datasets at regular intervals (50mm), key statistical indicators such as mean bias error (MBE) and 95th percentile maximum error (P95) were derived. The remainder of this paper is as follows. In Section 2, the trends in 3D geometric modeling for microclimate environment simulation and limitations of conventional 2D drawing-based methods are examined. Furthermore, prior research on data integration technologies based on 3D laser scanning (Scan-to-BIM) to overcome these limitations is reviewed to derive the distinctive contribution of this study. Section 3 explains the overview of the study site and operation methods of data preprocessing and alignment algorithms. In Section 4, the distribution of geometric deviations in the exterior walls is analyzed through statistical tables and visualization results, examining the limitations of drawing-based modeling. Section 5 summarizes the conclusions and practical recommendations.
2. Literature Review
2.1. Trends in 3D Geometric Modeling for Climate and Wind Environment Analysis
CFD-based simulations have been actively conducted to predict and address urban microclimate issues such as the urban heat island effect, spread of fine dust, and pedestrian wind environments [2,14]. The analysis results of CFD simulations are greatly influenced by the geometric shape and surface roughness of the 3D model used as boundary conditions. According to previous studies, the fine surface roughness, thickness of finishing materials, and protruding columns on the exterior walls of buildings induce flow separation, reattachment, and vortex formation, which act as key factors altering the surface convective heat transfer coefficient and wind pressure distribution [12,13]. Therefore, for reliable environmental simulations, constructing 3D models with an appropriate level of detail (LoD) that can accurately replicate the actual physical environment is essential [3,15].
2.2. Limitations and Geometric Errors of 3D Modeling Based on Conventional Drawings
Despite the increasing academic demand for geometric precision in microclimate simulations, the majority of environmental simulation research and practice has conventionally used mass models created by simply extruding the planar lines of geographic information system (GIS) data or conventional 2D drawings for maintenance purposes [5]. This drawing-based approach has the advantage of simplifying the modeling process and reducing computational load, but has the limitation of not accurately reflecting the shape of the actual completed building [6].
In particular, most conventional FM drawings are often “design intent” models centered around the structure (frame) so that the physical thickness of insulation and exterior finishing panel systems attached during construction is often omitted from the drawings [8]. Furthermore, in the case of aging buildings, long-term structural deformations or construction tolerances have not been reflected in the current drawings [10]. If a 3D model that completely omits the actual volume of the finishing materials and macroscopic distortion of their shapes is directly used for airflow analysis, a significant risk of underestimating the reduction effect of the airflow path caused by the volumetric expansion of the building or flow separation phenomenon occurring at large local protrusions exists, leading to serious errors in airflow pattern predictions [13,14].
2.3. Trends in Utilization of 3D Laser Scanning and Reverse Engineering Technologies
To overcome the uncertainties of conventional 2D drawing data, the construction and facility maintenance sectors have increasingly adopted 3D point cloud data (PCD) using 3D laser scanning (LiDAR) technology and the reverse engineering (Scan-to-BIM) technique as a promising alternative [6,8]. LiDAR technology can collect surface information about objects in 3D coordinates with errors on the order of a few millimeters. Thus, it is widely used for construction quality control, structural safety diagnosis, and displacement monitoring [9,10].
Several recent studies measured geometric shape errors by comparing these 3D scan data with conventional design drawings [7,8]. However, conventional error analysis studies have mainly focused on the basic assessments of construction accuracy (e.g., smoothness, verticality) of newly constructed structures [10]. In the process of aligning coordinate systems between heterogeneous data, many studies have relied on manual overlays of commercial 3D software or the black-box functionality of general-purpose iterative closest point (ICP) algorithms [8]. This situation raises concerns that errors may be corrected or distorted by the researcher’s subjective judgment, and clear methodological limitations exist in objectively proving ‘systematic bias due to the omission of external materials’ based on large surface datasets containing tens of thousands of points. Moreover, a relative lack of critical examination exists regarding the inherent limitations of the instruments and human errors of the operators that inevitably come into play during the process of converting 3D PCD into a linear model suitable for simulation.
2.4. Summary and Distinctive Contributions of This Study
Based on a review of previous studies, we concluded that in the field of environmental simulation, while the importance of 3D model shapes was recognized, the limitations in data acquisition have led to the acceptance of morphological errors in conventional drawings. On the other hand, although technology for precision error analysis has advanced in the field of 3D scanning-based reverse engineering, there has been a lack of integrated research that critically examined the limitations of conventional drawings by quantifying the expansion of finishing material thickness in aging buildings at the operational stage and linking it to an environmental interpretative perspective.
In this regard, this study possesses distinct academic contributions in the following three aspects. First, breaking away from the conventional method that relied on manual alignment using commercial software, we independently developed and applied a Python-based centroid auto-alignment algorithm and KD-Tree spatial search technique. This enabled us to mathematically and objectively extract 15,224 matching point errors between 2D design drawings and contour drawings based on scanned data, without subjective intervention from the operator. Second, beyond simple bidirectional error measurement, the MBE and P95 statistical indicators were introduced. This enabled us to quantitatively visualize and demonstrate the structural bias of ‘missing external finishing material volume’ inherent in conventional maintenance drawings. Third, it logically examines the limitations that environmental simulation modeling using conventional 2D FM drawings can cause and suggests that the introduction of 2D drawings derived from 3D scans, which reflect actual deformation and construction thickness, is necessary for next-generation precise microclimate analysis and digital twin construction.
3. Research Methodology
In this section, we describe in detail the data preprocessing, auto-alignment, and precise error calculation pipeline for quantitatively analyzing the geometric shape deviations between conventional 2D FM drawings and exterior boundary lines based on 3D LiDAR scans, focusing on the large, aging stone building of Korea University main building. The entire research process was implemented in-house using Python, utilizing spatial geometry libraries such as ezdxf, numpy, and scipy.spatial, to fundamentally eliminate shape distortions caused by the built-in algorithms of commercial software and subjective interventions by operators.
3.1. Selection of Target Building and Acquisition of 3D PCD
The target site of this study, the Main Building of Korea University, is a modern stone building completed in 1934, and has the optimal structural conditions to demonstrate the feasibility of introducing microclimate simulation (Scan-to-CFD) based on 3D laser scanning (LiDAR). Many years have passed since its completion, and the accumulated structural deformations and finishing repair records have not been reflected in the current 2D FM drawings.
The 2D FM drawings referenced in this study are the computerized (CAD) maintenance plans prepared in October 2001, which are held and managed by Korea University for the purpose of maintaining the main building facilities. These plans were created a considerable time after the completion of the building, which was finished in 1934, and primarily depicted the structural framework and interior space. The physical thickness of the exterior wall finishing system was not reflected, and maintenance repairs, partial renovations, or long-term structural deformations carried out after the drawings were made have been updated only sporadically. These characteristics of drawing and management are directly related to the fundamental cause of the bias caused by the omission of exterior finishing thickness identified in this study.
To visualize these actual geometric shapes, this study utilized the 3D terrestrial laser scanner (TLS) Leica RTC360 to perform scanning at multiple stations around the target object (Fig. 1.), thereby obtaining a high-density PCD of the exterior wall surface. The nominal accuracy of the Leica RTC360 used was an angular accuracy of 18″ and a distance accuracy of 1.0mm+10ppm according to the manufacturer’s specifications, and the 3D point accuracy was 1.9mm at 10m, 2.9mm at 20m, and 5.3mm at 40m (all accuracies were based on a 68% confidence level according to GUM (JCGM 100:2008)).
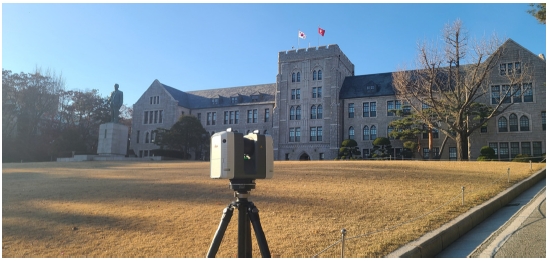
3D scanning of Korea University Main Building
3.2. 3D Scan Data Registration and 2D Contour Extraction
Point cloud data acquired in segments from multiple scanning stations on-site were integrated into a single 3D model through the data registration process in Leica Cyclone REGISTER360 PLUS software (Fig. 2.).
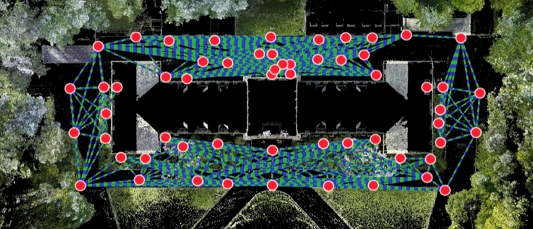
Scanning locations and scan data registration
The integrated 3D scan data were filtered to remove unnecessary surrounding backgrounds (such as trees, pedestrians, and nearby structures) and diffuse reflection noise to enhance the accuracy of the drawings (Fig. 3.).
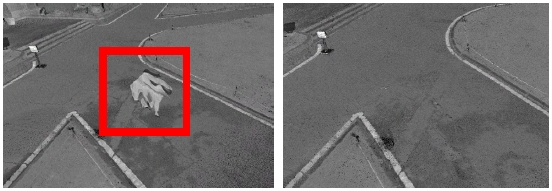
Noise removal from scan data
To extract the main exterior wall contours, the horizontal slicing technique was applied in Cyclone 3DR software to cut thin cross-sections at specific height intervals along the Z-axis (Fig. 4.). In this process, rather than preserving microscopic surface undulations, the processed scan-based 2D planar lines were vectorized into a polygonal form connecting the main corners to maintain the same level of geometric object representation as conventional 2D FM drawings. However, although conventional FM drawings are linear representations centered on the framework with the finish thickness excluded, the actual scanned lines in this case have a clear distinction, as they are contours derived from the outermost building envelope surface, thereby incorporating the physical thickness of the exterior material and macroscopic shape distortions caused by construction errors.
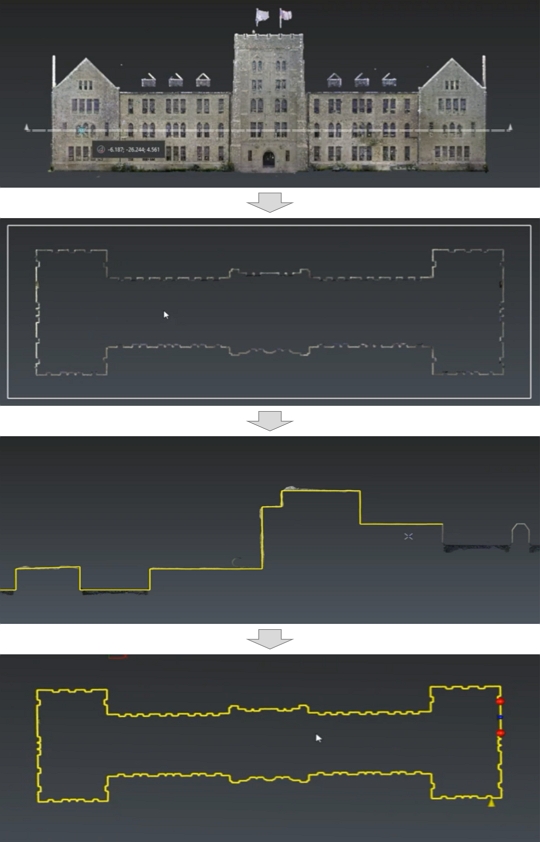
Section extraction from scan data and polyline generation
For the original reference data for design intent comparison, we collected the 2D CAD floor plans currently used for facility maintenance. Then, we completed the preparation for shape error analysis by extracting and separating the external finish contours at the same level as the scan data into pure geometric objects.
3.3. Linear Data Preprocessing and Point Discretization
To compute the precise geometric deviation between the reference data based on drawings and actual measurement data based on laser scans, the spatial resolutions of the two datasets were matched before comparison. Both the conventional FM plan and LiDAR scan contour data were extracted in the DXF format, which was the international standard for drawing exchange.
To precisely compare data composed of combinations of line segments of different lengths on a 1:1 basis, this study utilized the Python ezdxf open-source library to parse the geometric information of the drawings. Subsequently, the linear interpolation method was applied to discretize all outer lines of the FM and scanned drawings at regular intervals of 0.05m (50mm), replacing them with a dense point cloud array. Sampling at regular intervals yielded 15,224 accurate matching points; this was a necessary preprocessing step to objectively compare the geometric deviations between the two drawings in the 2D plane. Discretizing the continuous linear data into a dense point cloud provided a clear basis for mathematical operations to achieve geometric center alignment and KD-Tree-based short-distance error search.
3.4. Centroid-Based Auto-Alignment of Coordinates
When analyzing spatial geometric deviations between heterogeneous data, the automatic alignment feature provided by commercial 3D software or the general-purpose ICP algorithm is generally the first approaches to be considered. However, these algorithms aim to minimize the distance mechanically between the two datasets, which leads them to perceive the “overall volumetric expansion due to the thickness of the finishing material” that this study seeks to elucidate as a mere error, artificially compressing and distorting the data. To prevent such data corruption, practitioners often rely on arbitrary manual alignment based on specific corners, which carries a high risk of falling into optimization errors where the reference points vary according to the subjective judgment of the operator, leading to incorrectly aligned geometries. Therefore, this study independently implemented a centroid-based auto-alignment algorithm in Python, which performed only parallel translation while maintaining the overall contour integrity of the building, to fundamentally eliminate the issues of “shape distortion” in commercial auto-alignment and “subjective intervention” in manual alignment.
Based on the minimum and maximum coordinate values of the reference drawing point cloud (Pcad) and scan point cloud (Plidar), the center point coordinate (C) of the bounding box was identified. Subsequently, the distance difference between the centroid of the CAD drawing (Ccad) and centroid of the LiDAR data (Clidar) was calculated to derive the shift vector (Vshift). By uniformly adding the calculated vector to the entire LiDAR point cloud matrix, the alignment was completed, ensuring that the two datasets shared a common centroid in a single absolute coordinate system without any subjective user intervention (Fig. 5.). Thus, the scan data obtained in 3D space corresponds to the data on the 2D plane (X, Y) coordinate system of the 2D drawings.
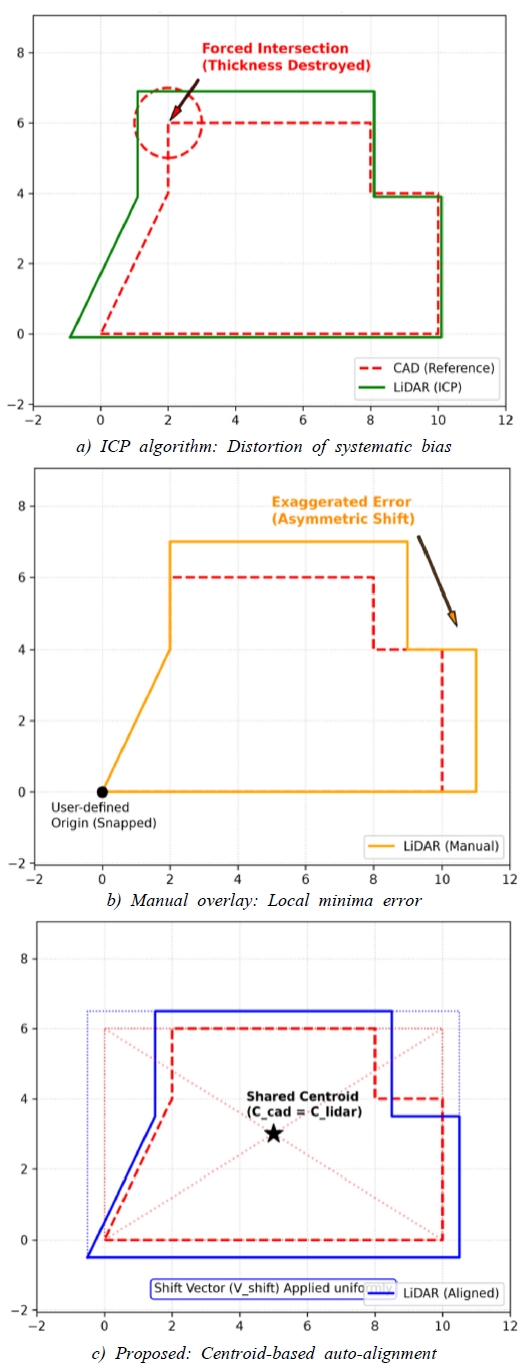
Comparison of alignment strategies: ICP, manual overlay and centroid-based method
3.5. KD-Tree Spatial Search and Directional Deviation Calculation
To calculate the shortest distance error between the CAD reference and LiDAR measured models after auto-alignment, the KD-Tree spatial search algorithm from the SciPy library, known for its high computational efficiency, was introduced (Fig. 6.). First, a 2D KD-Tree space was constructed for the entire LiDAR contour point cloud, which was discretized in a 2D plane coordinate system (X, Y), and then the absolute distances were calculated by searching for the nearest LiDAR point from each CAD reference point.
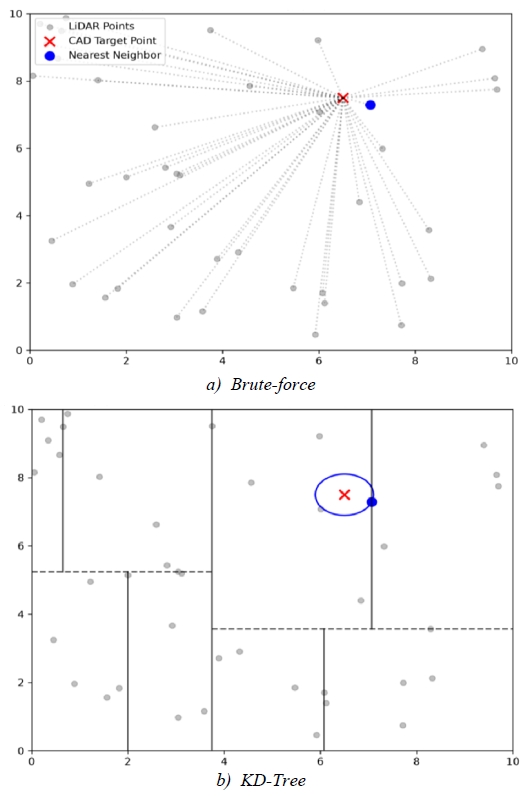
Comparison of nearest neighbor search: a) Brute-Force vs. b) KD-Tree
The typical distance calculation results were expressed only as scalar absolute values, making it impossible to determine the geometric “directionality” of whether the actual building has expanded (protruded) outward or contracted inward compared to the drawing. This study devised a sign determination algorithm using vector dot products to objectively demonstrate the external protrusion phenomenon caused by the attachment of finishing materials to calculate the signed deviations. The dot product between the direction vector (Vref) from the geometric centroid of the building to the reference exterior wall CAD point and actual geometric deviations vector (Verr) from the CAD point to the corresponding matched LiDAR point was calculated. If the dot product between the two vectors is positive (>0), it is defined as protruding outward (+) compared to the drawing; and if it is negative (≤0), it is defined as sinking inward (-). This directional error sign was assigned to all 15,224 points.
3.6. Setting Key Statistical Indicators for Quantitative Evaluation
To objectively evaluate the derived directional deviation data and demonstrate the geometric limitations of conventional FM drawings, the following key statistical indicators were used as evaluation metrics. In addition to the coefficient of determination (R2) and Root Mean Squared Error (RMSE) to verify the overall geometric agreement of the 2D space, Mean Bias Error (MBE) was introduced as a key indicator to prove the core hypothesis of this study (Fig. 7.). MBE is particularly useful for quantifying the consistent expansion level of building volume due to the omission of external finishes, as it calculates the average without offsetting the sign (+/-) of the error. In addition, P95 was established as a reliable indicator of the maximum error limit to identify realistic maximum local shape deformations affecting airflow path and turbulence generation predictions, while excluding outliers such as laser scanning diffuse reflections.
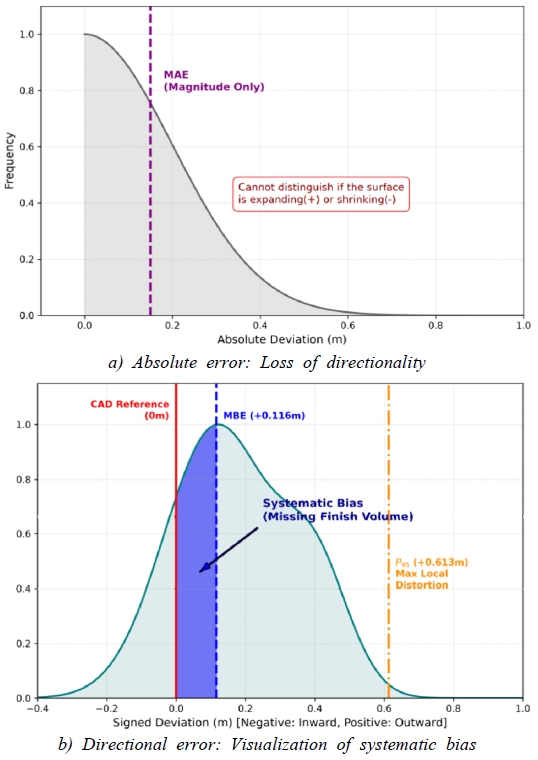
Statistical proof of missing finish volume: Absolute Error (Loss of Directionality) vs. Directional Error: Visualization of Systematic Bias
Furthermore, a tolerance range of ±30mm was set based on construction practice regulations, and we calculated the proportion of the total data that fell within this range, thereby comprehensively verifying the limitations of conventional drawings as boundary condition models for environmental simulations.
4. Results and Discussion
4.1. Centroid Coordinate Alignment Results and Visual Evaluation
The visual results of aligning the planar linear drawings of 2D FM drawings and 3D LiDAR scan data using the Python-based centroid auto-alignment algorithm are shown in Fig. 8. The R2 representing the overall geometric agreement was calculated to be 0.9996, which demonstrated that the alignment algorithm proposed in this study aligned the macroscopic coordinate systems of the two datasets to a mathematically near-perfect level without local optimization errors.
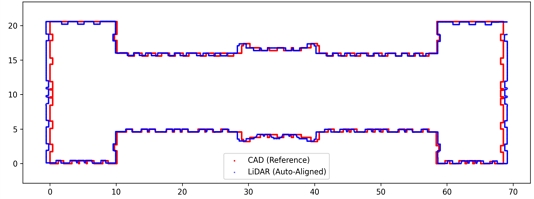
Alignment of FM and scan data-based drawings based on centroid-based method
However, visually comparing the two aligned datasets in detail clearly reveals that the actual scanned data drawings (blue solid line) expand outward at a consistent interval around the entire building, relative to the outlines of the 2D FM drawings (red solid line). This result provides visual support for the hypothesis of this study, which posits that conventional maintenance FM drawings are created based on the framework, omitting the physical volume of insulation materials and exterior finishing systems (e.g., panels and stones) actually installed on site.
4.2. Quantitative Analysis and Statistical Characteristics of Geometric Deviations in Exterior Walls
To quantify the visually observed geometric deviations in millimeters, the directional deviations for 15,224 matching points were calculated using the KD-Tree spatial search and vector dot product sign determination algorithm. The derived key statistical indicators are summarized in Table 1., and the four-part error distribution histogram is shown in Fig. 9.

Statistical analysis of geometric deviations between 2D drawings and 3D scan contours
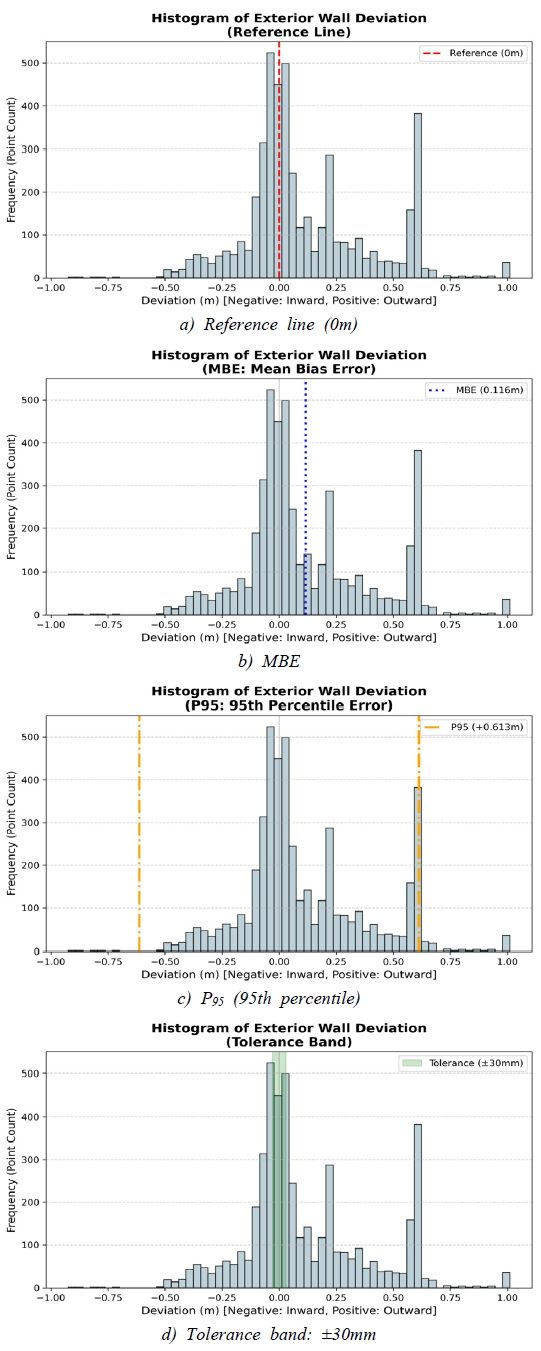
Histogram of exterior wall deviation
The RMSE and mean absolute error (MAE), which indicated the absolute scale of the overall deviation, were found to be 0.2319m and 0.1768m, respectively. In particular, the most important indicator in this analysis is the MBE, which is calculated while maintaining the directionality (+/-). As a result of the calculations, the MBE was derived as +0.1160m (Fig. 9.), which meant that the scan-derived contour extended outward (+) by an average of approximately 11.6cm compared to the drawings. Considering that the physical thickness of the typical insulation and exterior finishing systems applied to large buildings is around 100~150mm, this value indicates a systematic bias that very realistically reflects the actual thickness of the cladding system missing in the conventional drawings. Furthermore, the skewness indicating the asymmetry of the data distribution also has a clear positive value of +0.5407, statistically supporting the relatively large proportion of the exterior walls protruding beyond the baseline.
To evaluate the realistic maximum form deformation while excluding outliers such as the diffuse-reflection noise associated with laser scanning, the P95 was analyzed, resulting in +0.6130m (Fig. 9.). This value is higher than the systematic bias (+11.6cm) due to the finishing materials, which proves the existence of a geometric distortion of more than 61.3cm between the drawings and real shape in certain localized zones due to the protrusions of the building facade, thick projecting columns, 3D frames of the facade, or deformations that occur during construction. However, this value cannot exclude the fact that it is a mixture of the real protrusions of the building, diffuse reflection noise during the scanning process or errors of manual correction (human error) caused by the operators during the extraction of 2D lines from the point cloud (e.g., Quick Draw). The maximum outward error is +1.0118m, and the maximum inward error is -0.9025m, showing that unlike the ideal 2D plan drawings, the real site has a large number of these large-scale local deviations.
The following is the result of applying the tolerance range (±30mm) for smoothness commonly used in construction practice (Fig. 9.). Out of a total of 15,224 data points, only 13.91% fell within this tolerance range. In other words, approximately 86.09% of the analyzed outer wall contour points exhibit severe geometric deviations of ±30mm or more from the drawing information.
4.3. Error Budget and Attribution of Scan and Extraction Errors
To determine whether the previously calculated deviations are attributable to the actual shape difference of the building or errors introduced during the measurement and extraction processes, an error budget was constructed to aggregate the uncertainties at each stage of the data generation pipeline, as shown in Table 2. The sources of error are broadly categorized into (1) the measurement uncertainty inherent to the scanner, (2) the registration uncertainty of the multi-station point cloud, and (3) the extraction stage uncertainty of discretizing continuous lines into point clouds and vectorizing them into 2D outlines.
Error budget of scanning-and-extraction pipeline for LiDAR-based 2D contour
The measurement uncertainty of the instrument was estimated to be approximately ±2.9mm, based on the manufacturer’s specifications (3D point accuracy) and scan distances used in this study (approximately 5~20m). The multi-station point cloud was confirmed to be approximately ±3.0mm based on the registration error between point clouds (cloud-to-cloud) in the Cyclone REGISTER 360 PLUS registration report. In the extraction stage, horizontal slicing with a thickness of 1mm, discretization at intervals of 50mm, and the operator control error associated with semi-automatic vectorization (Quick Draw) were involved, and conservatively estimated to be approximately ±15mm. As a result of combining the independent sources of error using the root sum of squares (RSS), the combined measurement and extraction uncertainty for the entire pipeline was evaluated to be approximately ±15.6mm.
This value is significantly smaller than the mean bias (MBE +116mm) and the 95th percentile deviation (P95 +613mm) observed in Section 4.2. In other words, most of the observed deviations cannot be explained solely by errors in the measurement and extraction processes but are primarily attributed to the physical geometric differences due to the actual thickness of the missing cladding finish in the drawings centered on the framework and deformation of the shape after completion. However, because the local extreme values at the P95 level may partially merge with diffuse reflection noise and human errors during vectorization, this residual uncertainty must be considered when interpreting the local maximum deviation.
The combined uncertainty (RSS) is the value obtained by combining independent error dimensions (instrument 3D point accuracy ±2.9mm, registration ±3.0mm, slice ±1mm, vectorization ±15mm), and because distance and angle accuracy are detailed specifications that make up the 3D point accuracy, they are not redundantly summed.
4.4. Awareness of Geometric Limitations Between Heterogeneous Data and Considerations for Simulation Use
The impact of the geometric deviation quantified in this study on the microclimate interpretation results can be estimated in terms of its magnitude and direction through a case analysis that substitutes the measured deviations of this study into the flow and heat transfer relationships quantified in previous studies, without the need for separate CFD measurements. Urban airflow is predominantly determined by the geometric shape of buildings, and the CFD evaluation of pedestrian wind environments is also based on models that accurately reflect the actual shapes [16,17,18]. In particular, when interpretations are performed using simplified geometries, the errors can have a greater impact on the results than the choice of turbulence model or inflow conditions [19]. In this section, we examine the potential impacts of (1) volume and shielding, (2) local separation, and (3) surface heat transfer, which are induced by omission of finish and shape distortion.
(1) Volumetric expansion and shielding effects. The outward deviation of the outer contour due to the omission of the outer finish (MBE +0.116m) expands the windward projection width of the building, and the relative increase in the frontal projection area is approximated as ΔA/A≈2·MBE/W (W: building width perpendicular to the wind direction). Because the subject is located in a relatively open area that does not form a narrow passage with adjacent buildings, this produces a slight increase in the stagnation area and shielding effect on the windward side of the building, rather than the airflow acceleration (Venturi effect) that occurs in narrow alleys. In large buildings, although this increase is less than 1%, it means that the drawing-based model consistently underestimates the actual shielding volume caused by the building, and this volumetric deviation may also affect the width of the building wake and size of the recirculation zone [16,17].
(2) Flow separation due to local shape distortion. Local protrusions and roughness extending to P95 +0.613m (maximum +1.0118m) are not represented in the smooth model based on the drawing. The protrusions and indentations on the facade have been identified as key factors that altered the separation and reattachment points of the airflow and surface pressure distribution [12,13], and the omission of such geometric details might distort predictions of the downstream structure and local turbulence generation. Considering that the building shape itself dominates the flow in an open site, the omission of these local deviations may represent a major source of error in the drawing-based model of the subject, and aligns with reports [19] that the errors induced by shape simplification can surpass other numerical factors in the analysis.
(3) Surface details and convective heat transfer. The actual thickness of the finish and omission of fine surface roughness reduce the geometric level of detail (LoD). The convective heat transfer coefficient (CHTC) of a building envelope is highly sensitive to the airflow structure near the surface, and the geometric detail significantly affects the local distribution of the CHTC [11,20,21]. Therefore, model drawings that omit finishes and details can introduce biases in predicting surface thermal environments and cooling loads, which is consistent with previous studies [3,15] that point out differences in the accuracy of microclimate interpretations based on detail levels.
The above discussion is not based on results verified through direct CFD comparison but rather on literature-based estimates where the empirical deviations of this study are substituted into the quantitative relationships of previous research (Table 3.). The verification of the quantitative impact on the actual flow field will be presented as a follow-up task in Section 5.
Case analysis of potential CFD implications of measured geometric deviations (literature-based estimation)
The scan-based 2D contour model constructed in this study simplifies the fine textures of the surface during the polygonal vectorization process, and the local deviations at the P95 level may include some noise and extraction errors from the scanning process. However, the essence of this study is not the microscopic reproduction of the model but rather the quantitative identification of the “systemic bias” that arises from conventional FM drawings created with a focus on the framework, thereby omitting the volume of finishing materials and the macroscopic deformation of the building. Even though it is a polyline, a model containing volume and column position information that reflects the actual completed shape has much higher physical validity as a boundary condition for CFD simulation compared to the conventional ideal mass model that completely excludes this information.
Therefore, to create an accurate digital twin environment and for reliable microclimate simulations, we need to break away from the practice of relying solely on conventional FM drawings. Researchers and practitioners should be aware that the drawing data contain the “omission of finishes and smoothing errors,” and the scan data contain the “morphological overrepresentations and extraction errors.” The results of this study show the importance of the volumetric expansion (+0.116m) and the need to use this type of model as a basis for securing macroscopic wind direction and interpretation of interactions between buildings. However, a fusion approach is necessary to properly correct the local noise (above P95) using linear geometric information from conventional drawings.
4.5. Generality and Scope of Methodology
The centroid auto-alignment–KD-Tree deviation computation pipeline proposed in this study does not depend on specific building shapes; in principle, it can be applied equally to various types of buildings. However, there are limitations to consider depending on the type of target. This study selected large, aged stone buildings with distinct deviations in facade protrusions and finishing thicknesses because these conditions allow for the clearest observation and quantification of geometric deviations between drawings and actual measurements. On the other hand, in the case of high-rise buildings, it is difficult to capture the setback or changes in the upper-level geometry with a single horizontal cross-section at one elevation, necessitating the analysis of multiple height cross-sections. In curved or irregularly shaped complex buildings, the simplification error in polygonal vectorization can be relatively larger. In simple box-shaped buildings, the bias due to finishing thickness (MBE) is expected to be similar, but the local shape distortion (P95) is anticipated to be small. Therefore, the generality of the proposed method should be further verified through cross-validation involving buildings of different types, uses, and ages.
5. Conclusions
Recently, the use of CFD-based precise environmental simulations has increased substantially to address microclimate issues such as urban heat island effects and the deterioration of wind environments. However, limited attention is paid to the geometric precision of 3D model shapes, which are critical boundary conditions for the analysis. In most research and practice, 3D mass models have been constructed relying on 2D maintenance drawings for convenience. The present study quantitatively analyzed the geometric shape errors between the actual point cloud data obtained through 3D laser scanning (LiDAR) of real buildings and conventional 2D drawings and examined the potential risks for distortions in environmental simulation results inherent in drawing-based modeling. The key conclusions of this study are as follows.
First, this study successfully built a Python-based mathematical data preprocessing and error analysis pipeline. Moving away from the conventional practice of relying on black-box algorithms of commercial software or manual registration by operators, we applied centroid-based auto-alignment and KD-Tree spatial search techniques. Furthermore, by introducing a vector dot product algorithm, we objectively calculated the directional (protrusion/recession) deviations for 15,224 exterior wall matching points, thereby ensuring methodological reliability.
Second, the systematic bias caused by the missing exterior wall finishing system in the conventional drawings was quantitatively demonstrated. As a result, the overall geometric agreement (R2) between the two data sets was very high at 0.9996, but the MBE was +0.1160m, confirming that the actual building consistently extended outward relative to the drawings. This analysis demonstrates that the fundamental geometric error arises from the fact that conventional FM drawings are created based on the structural frame, resulting in the omission of the physical thickness (approximately 11~12cm) of the installed insulation and exterior finishing panels. Conversely, this also implies a dual limitation where the scan data can exaggerate the original linearity of the structure depending on the surface finish condition, noise, and extraction method.
Third, the scale of local geometric distortion can cause errors in microclimate simulation results. The 95th percentile error limit (P95) reached +0.6130m, and the proportion of normal values that satisfied the smoothness tolerance range (±30mm) in the entire dataset was only 13.91%. In other words, we confirmed that approximately 86.09% of the actual building facade exhibited significant geometric deviations with the drawing information. If a 3D model that reflected the omission of these massive facade protrusions and volumetric reduction errors was used without correction for environmental analysis, this could lead to an underestimation of the acceleration of airflow between buildings due to the reduced shielding volume, as well as distortion of flow separation and vortex generation points. However, we also confirmed that these significant deviation values did not solely indicate structural deformation of the building but could also be the result of combined scan noise and reverse engineering extraction errors.
In summary, neither conventional drawings nor LiDAR scan data can be regarded as the absolute truth, as both types of data have their own different forms of geometric errors and limitations. To achieve precise microclimate interpretation and the establishment of a digital twin environment, we must move away from the practice of merely accepting the provided data. The results of this study suggest that researchers and practitioners must clearly recognize the characteristics and inherent errors of each data set (such as volumetric omissions in drawings, morphological overrepresentation in scan data, and human errors) and diligently proceed with data selection and thorough geometric correction processes that align with the purpose of the simulation. Ultimately, the reliability of precise microclimate simulations and digital twin-based environmental performance evaluations starts with the quality of the 3D geometric data used as input. The significance of this study lies in its methodology for quantitatively diagnosing that quality at a millimeter level.
Yet, this study has the limitation of analyzing geometric deviations based on the 2D outline of horizontal sections obtained at a specific height for a single large building. Horizontal slicing at a single height cannot capture vertical directional shape changes such as floor setbacks, eaves, cornices, and roof sections; thus, the two-dimensional deviation indicators derived in this study must be interpreted as proxy indicators for the 3D geometric deviations of the entire building envelope. Considering that microclimate CFD analysis inherently deals with 3D flow fields, caution must be exercised when generalizing the quantitative results derived from 2D cross-sections as indicators of the accuracy of the 3D analysis. Further verification using multi-height cross-sections or 3D surface deviation analysis is necessary.
In addition, the process of extracting 2D linear data from the LiDAR point cloud involves semi-automatic vectorization using Quick Draw, which may introduce minor human errors, suggesting that the scan data cannot be considered a perfect absolute standard. Moreover, the quantified geometric deviations have not been directly verified through fluid analysis to determine the specific degree of sensitivity induced on actual airflow velocities or surface CHTC values. Therefore, in future research, we aim to directly verify the sensitivity of the microclimate prediction results caused by the volumetric expansion (+0.116m) and local deviation (P95 +0.613m) obtained in this study by constructing a drawing-based mass model and a scan-based precision model and conducting comparative CFD simulations under identical conditions, quantitatively comparing the differences in wind speed at pedestrian height, turbulence kinetic energy, and surface CHTC.
Acknowledgments
This study was supported by the Ministry of Land, Infrastructure and Transport Urban Regeneration Specialist Training Project.
References
-
Y. Toparlar et al., The effect of an urban park on the microclimate in its vicinity: A case study for Antwerp, Belgium, International Journal of Climatology, 38(S1), 2018, pp.e303-e322.
[https://doi.org/10.1002/joc.5371]

-
M. Piro et al., The urban heat island under climate change: Analysis of representative urban blocks in Northwestern Italy, Energies, 17(3), 2024, 660.
[https://doi.org/10.3390/en19030660]
-
D.F. Laefer, M. Anwar, Review of strategies for the geometric creation and population of urban microclimate models, The Open Urban Studies Journal, 5, 2012, pp.22-31.
[https://doi.org/10.2174/1874942901205010022]
-
V.P. Lopez-Cabeza, M. Videras-Rodriguez, S. Gomez-Melgar, An open-source urban digital twin for enhancing outdoor thermal comfort in the city of Huelva (Spain), Smart Cities, 7(5), 2024, 160.
[https://doi.org/10.3390/smartcities8050160]
-
I. Pađen, C. García-Sánchez, H. Ledoux, Towards automatic reconstruction of 3D city models tailored for urban flow simulations, Frontiers in Built Environment, 8, 2022, 899332.
[https://doi.org/10.3389/fbuil.2022.899332]
-
D. Chen et al., Structure- and semantics-aware mesh simplification for generating lightweight 3D building models, Remote Sensing, 16(6), 2024, 914.
[https://doi.org/10.3390/rs18060914]
-
C. Thomson, J. Boehm, Automatic Geometry Generation from Point Clouds for BIM, Remote Sensing, 7(9), 2015, pp.11753-11775.
[https://doi.org/10.3390/rs70911753]
-
M. Bonduel et al., Scan-to-BIM output validation: Towards a standardized geometric quality assessment of building information models based on point clouds, ISPRS International Archives of the Photogrammetry, Remote Sensing and Spatial Information Sciences, XLII-2/W8, 2017, pp.45-52.
[https://doi.org/10.5194/isprs-archives-XLII-2-W8-45-2017]
-
A. Surendiran et al., BIM-integrated parametric modelling of existing box girder bridges using point cloud data, International Journal of Bridge Engineering, Management and Research, 3(2), 2024.
[https://doi.org/10.70465/ber.v3i1.75]
-
S. Bao et al., A 3D laser scanning and BIM-based workflow for localization and classification of MEP pipe installation discrepancies, Buildings, 14(12), 2024, 2444.
[https://doi.org/10.3390/buildings16122444]
-
A. de Lieto Vollaro, G. Galli, A. Vallati, CFD analysis of convective heat transfer coefficient on external surfaces of buildings, Sustainability, 7(7), 2015, pp.9088-9099.
[https://doi.org/10.3390/su7079088]
-
H. Gough et al., Influence of neighbouring structures on building façade pressures: Comparison between full-scale, wind-tunnel, CFD and practitioner guidelines, Journal of Wind Engineering and Industrial Aerodynamics, 189, 2019, pp.22-33.
[https://doi.org/10.1016/j.jweia.2019.03.011]
- P. Saadatjoo, Investigating the effect of building facade recess on urban wind flow performance, Armanshahr Architecture & Urban Development, 14(37), 2022, pp.45-63.
-
E. Yasa, K. Özdemir, The impacts of air pressure differences on microclimatic wind comfort among low-rise buildings in the historical urban landscape of the Bay of Kotor region, Montenegro, In: Environmental management: Pollution, habitat, ecology, and sustainability, London: IntechOpen, 2022.
[https://doi.org/10.5772/intechopen.101743]
-
H. Xu et al., Evaluating the performance of high level-of-detail tree models in microclimate simulation, ISPRS Annals of the Photogrammetry, Remote Sensing and Spatial Information Sciences, X-4/W3-2022, 2022, pp.277-284.
[https://doi.org/10.5194/isprs-annals-X-4-W3-2022-277-2022]
-
B. Blocken, J. Carmeliet, T. Stathopoulos, CFD evaluation of wind speed conditions in passages between parallel buildings—effect of wall-function roughness modifications for the atmospheric boundary layer flow, Journal of Wind Engineering and Industrial Aerodynamics, 95(9-11), 2007, pp.941-962.
[https://doi.org/10.1016/j.jweia.2007.01.013]
-
B. Blocken, Computational fluid dynamics for urban physics: Importance, scales, possibilities, limitations and ten tips and tricks towards accurate and reliable simulations, Building and Environment, 91, 2015, pp.219-245.
[https://doi.org/10.1016/j.buildenv.2015.02.015]
-
Y. Tominaga et al., AIJ guidelines for practical applications of CFD to pedestrian wind environment around buildings, Journal of Wind Engineering and Industrial Aerodynamics, 96(10-11), 2008, pp.1749-1761.
[https://doi.org/10.1016/j.jweia.2008.02.058]
-
A. Ricci et al., Local-scale forcing effects on wind flows in an urban environment: Impact of geometrical simplifications, Journal of Wind Engineering and Industrial Aerodynamics, 170, 2017, pp.238-255.
[https://doi.org/10.1016/j.jweia.2017.08.001]
-
B. Blocken et al., High-resolution CFD simulations for forced convective heat transfer coefficients at the facade of a low-rise building, Building and Environment, 44(12), 2009, pp.2396-2412.
[https://doi.org/10.1016/j.buildenv.2009.04.004]
-
T. Defraeye, B. Blocken, J. Carmeliet, Convective heat transfer coefficients for exterior building surfaces: Existing correlations and CFD modelling, Energy Conversion and Management, 52(1), 2011, pp.512-522.
[https://doi.org/10.1016/j.enconman.2010.07.026]