The Evaluation of Energy Efficiency of Apartment Units after Conversion of Balconies into an Integrated Part of Interior Living Space by Computing with ECO2 Software
© Copyright Korea Institute of Ecological Architecture and Environment
Abstract
International efforts to save Earth’s environment against global warming and environmental pollution have been made in many countries. Energy consumption of buildings has been continuously increasing, and it has been over 40% of total energy consumption in the world. Energy consumption of buildings in Korea reaches 24% of total energy consumption. So, Korea government has executed building energy rating systems to control energy consumption of buildings.
This study was carried out to evaluate the energy performance of apartment unit plans according to converting balconies into living areas. For the study, six types of input models were made. Two input models(SP1 and SP 2) were the standard units that balcony areas were not converted into living areas, and four ones(EP 1, EP 2, EP 3 and EP 4) were the extended unit plans that balcony areas were turned into living areas. All of them were simulated with ECO2 software to assess building energy efficiency.
According to the results, the energy performance of the EP 2 and EP 4 models were 21. 8% higher than SP 1 model and 9.2% higher than SP 2 model.
Keywords:
ECO2 Software, Collective Housing, Balcony, Energy Efficiency키워드:
에코 2 프로그램, 공동주택, 발코니, 에너지 효율1. Introduction
1.1. Background and Object of the Research
The climate change has posed a threat to survival of mankind. To cope with the climate change, many countries have made efforts to reduce the green house gas emission through the agreements such as United Nations Framework Convention on Climate Change in Rio (1992), Kyoto Protocol to the United Nations Framework Convention (1997), UN Climate Change Conference held in Copenhagen (2009), and agreed on Paris Agreement which has the legal binding force to share the responsibility to reduce the green house gas at 2015 United Nations Climate Change Conference (The twenty-first session of the Conference of the Parties (COP21)).1) The building part occupying over 40% of total global energy consumption is emitting the equivalent green house gas. So, energy efficient building is very important for the protection of global environment.
Many countries are enforcing green building certification criteria such as LEED (US), BREEAM (UK), CASBEE (Japan), and Korea government is implementing Energy Performance Index (EPI, 1979), Building Energy Efficiency Rating Certification (BEERC, 2001), Green Building Certification Criteria (GBCC, 2002), and Green Home Architecture Standard (GHAS, 2009).2) Also, Korean government set up the goal to reduce 30% of green house gas emission forecast in 2020, and decided the reduction goal for each fields as 34.3% in transportation, 26.9% in building, 26.7% in thermoelectric generation, 25% in public section, 18.5% in industry, 12.3% in wastes, 5.2% in agriculture and fishing.3)
Energy consumption of buildings in Korea is occupying over 24% of total energy consumption,4) and residential building is occupying about 54% of building energy consumption. Therefore, Korean government reorganized Green Standard for Energy & Environmental Design (G-SEED) and Building Energy Efficiency Rating Certification (BEERC) by the enactment of Green Building Construction Support Act (2013) to evaluate environmental performance of building and energy consumption efficiency. Among them, BEERC evaluates the energy consumption and CO2 emission volume for five items such as heating, cooling, lighting, hot water heating, and ventilation using ECO2 software to evaluate energy volume consumed in buildings.5)
Meanwhile, the balcony installed in apartment units tends to be converted into living room or bedroom according to the promotion of sales and preference of resident in domestic apartment market, which is positive on residential area extension, but negative on loss of thermal buffer space by balcony. Therefore, this study suggests basic data for energy effective unit plans of apartment by evaluating energy performance of unit plans with ECO2 software according to the conversion of balcony into living space.
1.2. Method and Range of Research
This study has been conducted as the follow up study of the energy efficiency evaluation of apartment units by heating degree day method6) and ECO2 software simulation7). So, some of input variables and evaluation models used in previous research were applied to the research.
The apartment unit which unit area was less than 85m,2 preferred in domestic apartment market, was selected as evaluation model, and three categories such as building energy demand, building energy consumption, and primary energy demand were calculated using ECO2 software. The process of this study is as follows:
Firstly, surveyed current state of energy efficiency rating certificate for collective housing and characteristic of ECO2 software.
Secondly, set up input models, and arranged physical parameters of input models for simulating with ECO2 software.
Thirdly, evaluated energy performance of input models by calculating three evaluation categories such as energy demand, energy consumption, and primary energy demand.
Fourthly, performed comparative analysis of primary energy demand on each input model.
2. Current State of Building Energy Efficiency Rating Certificate and Characteristics of ECO2 Software
2.1. Current State of Building Energy Efficiency Rating Certificate
The building energy efficiency rating certificate system was established in 2001, and total energy reduction rate of evaluation model was calculated on the base of the heating degree days method until August 2013. The building energy efficiency rating certificate system was changed with the method of ECO2 software simulation by Green Building Construction Support Act enacted on September 2013.
2,423 units of residential buildings and 1,388 units of non-residential buildings have been certified until September 2015. Based on [Table 1], 775 units obtained main certification and 1,648 units obtained preliminary certification. And, it is expected that the numbers of certification will be continuously increased. [Table 2] Currently, building energy efficiency rating certification is evaluated as 10 ranks from highest rank 1+++ to lowest rank 7.

Certification numbers of collective housing (September 2015)
Criteria of building energy efficiency rating certification
2.2. Characteristics of ECO2 software
ECO2 software calculates energy demand per unit area and year, energy consumption, and primary energy demand for five items of heating, cooling, lighting, hot water heating, and ventilation based on the global building energy evaluation standard ISO 137908) and DIN V185999).10)
Energy demand is the energy volume that building demands to maintain comfortable indoor environment under specific environmental condition, and energy consumption is calculated considering equipment efficiency to supply energy volume to building. Primary energy demand is energy volume11) including energy loss to occur during the whole process ‒ the collection, manufacturing, transportation, conversion, and supplying of fuel ‒ that supply energy to building, and it is calculated by multiplying conversion factor to energy consumption according to the purpose profile of building and heating type.
ECO2 software can not calculate sun shading effect by shading devices such as louver, eaves, balcony and earing, etc, and, it is not able to calculate the heating and cooling peak load during the year because it calculates energy performance of building through average monthly weather data.
3. Evaluation Model Set-up
3.1. Outline of Input Models
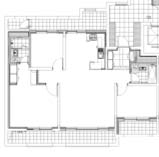
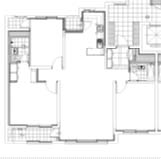
The apartment unit plans that unit area was less than 85m2 were selected as input models, and their front width and ceiling height are 9.3m and 2.4m, respectively. The insulation standard of southern region was applied for simulation, and individual heating system was chosen. [Table 3]
Summary of input models
3.2. Physical Characteristics of Input Models
The heating loss areas of the outer windows and walls that greatly influence on the energy performance of input models were calculated, and shown in [Table 4]. The heated area of standard unit plan(SUP) that balcony spaces were not integrated into living spaces such as living room or bed room was calculated as 84.99m2, and the heated area of extended unit plan(EUP) that balcony spaces were integrated into living spaces was calculated as 102.96m2. The heated area of EUP was 17.97m2 larger than the area of SUP. The outer wall areas for SUP and EUP were calculated as 42.35m2 and 53.44m2, respectively, and the outer wall area of EUP was 11.09m2 larger than the wall area of SUP. The window area of SUP and EUP were calculated as 27.36m2.
Heat loss area of imput models (unit: ㎡)
3.3. Evaluation Conditions of Input Models
The side unit located on middle stories of apartment was set-up for evaluation, and the thermal performance values of input models according to structural components has been calculated referring the heat transmission coefficient standard of southern region12) [Table 5], and the values applied to evaluation of input models.
3.4. Input Model Set-up according to Window Systems
PVC windows were applied for the evaluation of input models. The input models of SUP were set-up with two ones (SP 1, SP 2) by whether the balcony window was installed or not, and the input models of EUP were set-up with four ones (EP 1, EP 2, EP 3, and EP 4) according to the window systems installed on the balcony. So, six input models have been evaluated. The thermal performance values of six input models according to window systems are shown in [Table 6].
Thermal performance of structural components
Thermal performance of windows installed to input models
4. Energy Performance Evaluation for Input Models
4.1. Energy Performance Evaluation for Input Models of Standard Unit Plan
In order to evaluate the energy performance of SUP models (SP 1 and SP 2), the energy demand, energy consumption, and primary energy demand were calculated through simulating the energy performances of heating, cooling, lighting, hot water heating, and ventilation with ECO2 software. Simulation results are presented in [Table 7]. Main results of [Table 7] are as follows.
(1) Energy demand was calculated into 110.9 kWh/m2 in SP 1, and 96.5 kWh/m2 in SP 2. So, energy demand of SP 2 was 13.0% less than SP 1.
(2) Energy consumption was calculated into 114.7 kWh/m2 in SP 1, and 114.5 kWh/m2 in SP 2. So, energy consumption of SP 2 was 0.2% less than SP 1. There was not much difference between 2 models.
(3) Primary energy demand was calculated into 162.2 kWh/m2 in SP 1, and 154.5 kWh/m2 in SP 2. So, primary energy demand of SP 2 was 4.7% less than SP 1.
(4) SP 1 and SP 2 models were all evaluated as Rank 2 based on the standard of building energy efficiency rating certificate as shown in [Figure 1].
Energy performance of SUP models (kWh/m2)

Building energy efficiency rating of SUP models (unit : kWh/m2)
4.2. Energy Performance Evaluation for Input Models of Extended Unit Plan
In order to evaluate the energy performance for EUP models (EP 1, EP 2, EP 3, EP 4), the energy demand, energy consumption, and primary energy demand were calculated the same ways as SUP models were calculated. The calculation results are presented in [Table 8]. Main results are as follows.
(1) Energy demand was calculated into 95.7 kWh/m2 in EP 1, 93.3 kWh/m2 in EP 2, 92.8 kWh/m2 in EP 3, and 92.3 kWh/m2 in EP 4. Energy demand of EP 2, EP 3, and EP 4 models were 2.5%, 3.0%, and 3.6 % lower than EP 1 model, respectively.
(2) Energy consumption was calculated into 112.0 kWh/m2 in EP 1, 112.0 kWh/m2 in EP 2, 111.3 kWh/m2 in EP 3, and 111.9 kWh/m2 in EP 4. Energy consumption of EP 2, EP 3, and EP 4 models were 0%, 0.6%, and 0.1 % less than EP 1 model, respectively. The difference of energy consumption among 4 models was not much.
(3) Primary energy demand was calculated into 151.5 kWh/m2 in EP 1, 150.2 kWh/m2 in EP 2, 149.7 kWh/m2 in EP 3, and 149.6 kWh/m2 in EP 4. Primary energy demand of EP 2, EP 3, and EP 4 models were 0.9%, 1.2%, and 2.1 % lower than EP 1 model, respectively.
(4) EP 1 and EP 2 models were evaluated as Rank 2, and EP 3 and EP 4 models were evaluated as Rank 1 based on the standard of building energy efficiency rating certificate as shown in [Figure 2].
Energy demand of imput models of EUP models (kWh/m2)

Building energy efficiency rating of EUP models (unit : kWh/m2)
4.3. Energy Performance Comparison between SUP and EUP Models
As shown in [Table 7] and [Table 8], primary energy consumption of SUP models in hot water heating, lighting, and ventilation were the same as EUP models. In order to compare the energy performance of SUP models with the energy performance of EUP models, primary energy consumption in heating and cooling were analyzed. For the comparison, SUP models (SP 1 and SP 2) were set up as base case.
Based on [Table 9], the energy performance of EUP models increased 1.1%(EP 1, EP 3)∼4.2%(EP 4) in heating load, and decreased 42.2%(EP 1)∼51.5%(EP 4) in cooling load compared to results of SP 1 model, which indicated that the cooling load decrease improved energy performance of EUP models. The energy performance of EUP models was improved 17.8%(EP 1)∼ 21.8%(EP 3, EP 4) compared to SP 1 model.
Comparison of primary energy consumption of SP 1 model with EUP models in heating and cooling (kWh/m2)
Based on [Table 10], the energy performance of EUP models decreased 3.6%(EP 2)∼5.6%(EP 1, EP 3) in heating load, and also decreased 6.0%(EP 1)∼21.1%(EP 4) in cooling load compared to results of SP 2 model, which indicated that energy performance improvement by cooling load was larger than by heating load. The energy performance of EUP models was improved 5.7%(EP 1)∼ 9.2%(EP 3, EP 4) compared to SP 2 model.
Comparison of primary energy consumption of SP 2 model with EUP models in heating and cooling (kWh/m2)
As shown in the above description, the heating load of EUP models increased a little bit compared to SP 1 model, however, the cooling load of EUP models highly decreased compared to SP 1 model. The energy performance of EP 3 and EP 4 model were decreased 21.8% compared to SP 1 model. [Figure 3]
Also, the heating load and cooling load of EUP models were improved compared to SP 2 model. The energy performance of EP 3 model and EP 4 model decreased 9.2% compared to SP 2 model. [Figure 4]
However, the sun shading effect by balcony cannot be evaluated in the research because of the limit of ECO2 software, which can be the reason to highly increase cooling load in summer.

Comparison of primary energy consumption of EUP models to SP 1 model in the heating and cooling load (unit: PEC=(kWh/m2, RR=%)

Comparison of primary energy consumption of EUP models to SP 2 model in the heating and cooling load (unit: PEC=(kWh/m2, RR=%)
5. Conclusions
The energy performance of apartment unit plans was evaluated according to balcony conversion and window composition using ECO2 software. This research proposes basic data for energy effective apartment unit plans. The summaries of the research are as follows.
(1) According to the evaluation results of the SUP and EUP models, the primary energy consumption of SP 2 model was decreased 4.7% compared to SP 1 model, and the primary energy consumption of EP 2, EP 3, and EP 4 models decreased 0.9%, 1.2%, and 2.1 % compared to EP 1 model, respectively.
(2) Energy performance of EUP models increased 1.1%∼4.2% in heating load, and decreased 42.2%∼51.5% in cooling load compared to SP 1 model that balcony windows were not installed.
(3) Energy performance of EUP models decreased 3.6%∼5.6% in heating load, and 6.0%∼21.1% in cooling load compared to SP 2 model that balcony windows were installed.
(4) In the research, however, the sun shading effects by balcony could not be calculated because of the limit of ECO2 software. So, the cooling load of SUP models might be excessively calculated in summer. Therefore, there should be additional study on it.
Notes
(Refer to http://www.phiko.kr/bbs/board.php?bo_table=z3_01&wr_id=812)
References
- C. S. Kim, The Analysis on the Evaluation Items of Korea Green Building Certification Criteria by the Case Studies of Collective Housing, Journal of KIEAE, (2013, Apr).
- C. S. Kim, K. W. Seo, A Study on the Evaluation of the Building Energy Efficiency in Accordance with the Shapes of the Apartment Unit Plans, KIEAE Journal, (2013, Apr).
- C. S. Kim, The Influence of Unit Plan Shapes to the Energy Efficiency of Collective Housing Simulated by ECO2 Software, KIEAE Journal, (2015, Dec).
- J.W. Jeon, A Study on the Energy Saving Design for Public Office Buildings Using ECO2 Program, Joongang Univ, Master Thesis, (2013, Aug).
- A Study on Changes of the Energy Efficiency Rating according to the Revised Building Energy Efficiency Rating Certification System, Hanyang Univ, Master Thesis, (2015, Feb).
- C. Jung, Polinews:http://www.polinews.co.kr/news/article.html?no=259256.
- Ministry of Environment news release:http://me.go.kr/home/web/board/read.do?pagerOffset=0&maxPageItems=10&maxIndex Pages=10&searchKey=&searchValue=&menuId=286&orgCd=&boardId=339265&boardMasterId=1&boardCategoryId=&decorator=.
- Korea Energy Economics Institute, http://keei.re.kr.
- Korean Regulations for Building Energy Efficiency Rating Certification, (2013, Aug).
- Korea Energy Agency, Guideline for preparation of Building Energy Saving plan, (2011), http://www.kemco.or.kr/building/v2/.
- Energy Efficiency Rating Evaluation Program ECO2 and Analysis on Program Development Case in Germany, http://www.phiko.kr/bbs/board.php?bo_table=z3_01&wr_id=812.