
Interpreting Land Use Mix in Seoul Metro Station Areas with Multi-Radius Station-Area Types : A Compositional Diagnostic Approach to LUM, Station Ridership, Land Value, and Station-Area Context
ⓒ 2026. KIEAE all rights reserved.
Abstract
This study reinterprets land use mix (LUM) in Seoul metro station areas as a compositional diagnostic indicator rather than as a simple predictor of station ridership. The study therefore separates the internal composition of LUM from its external station-area correlates and asks what LUM actually represents in Seoul metro station areas.
Using Seoul metro station-area data, the analysis examines LUM at 250m, 500m, and 750m radii, with the station-line observation as the empirical unit. LUM values are available for 245 observations at each radius. Commercial, residential, industrial, and green shares are used to characterize the broad land use composition associated with LUM, whereas station ridership, land cost, workers, residents, subway frequency, bicycle parking, and public parking are interpreted as contextual correlates external to the LUM formula. Pearson and Spearman correlations, cross-validated ridge models, and representative case profiles are applied in sequence.
Seoul station area LUM is more strongly associated with land use composition than with ridership alone. At 750m, residential share is negatively associated with LUM (r=-0.492), whereas commercial and industrial shares are positively associated (r=0.419 and r=0.368). Ridership is positively but modestly associated with LUM (r=0.248, 0.204, and 0.195 at 250m, 500m, and 750m). Case profiles show that high LUM can represent commercial station-front activity, industrial-employment mixing, or broader neighborhood heterogeneity, whereas low LUM can represent residential dominance, green-edge constraint, or single-use centrality. LUM should therefore be interpreted in two steps, compositional interpretation and contextual association.
Keywords:
Land Use Mix, Station Area, Multi-Radius Analysis1. Introduction
This study reinterprets land use mix (LUM) in Seoul metro station areas as a multi radius compositional diagnostic indicator rather than as a universal performance score or a simple predictor of station ridership. Its purpose is to establish a two step interpretive procedure in which LUM is first interpreted in relation to its land use composition and only then related to external station area context. Land use mix is a central concept in station area and transit oriented development research, where mixed land use is treated as a desirable built environment condition that supports walking and multiple trip purposes [1,2]. This framing is useful but incomplete. LUM is not only a variable that may influence travel behavior, it is also an index produced by the distribution of land use categories within a defined spatial unit, and a given value has no single substantive meaning. A high value may indicate a balanced commercial-residential district, a historically layered industrial-employment area, or the coexistence of green and built land. A low value may indicate residential dominance, commercial dominance, or green edge constraint. Without examining the land use composition associated with the index, the meaning of a LUM value remains ambiguous.
This problem is notable in Seoul, as prior work applying Western TOD planning factors to Seoul’s rail station areas has shown that land use mix is significantly associated with transit ridership, but that the strength and even the direction of these associations can differ from lower density Western contexts [3]. But the Seoul metro system serves central business districts, older railway linked employment areas, high density residential districts, commercial centers, green edge stations, and transfer nodes, which do not share a single land use logic. Even when two station areas have similar LUM values, the land use combinations behind those values may differ substantially. The analytical radius further shapes the meaning of LUM. A 250m radius captures the immediate station-front environment, 500m represents the broader walkable catchment, and the 750m includes wider urban structure such as residential districts, employment areas, and green space. The same station can appear commercially mixed at 250m and residential dominated at 750m. LUM should therefore be treated as scale sensitive rather than as a fixed station attribute. Accordingly, this study distinguishes internal composition from external correlation as commercial, residential, industrial, and green shares are not treated as independent causes of LUM. Rather, they are used to characterize the broad compositional profile associated with observed LUM values. By contrast, station ridership, land cost, workers, residents, and transport service indicators are not components of the LUM formula, so their relationships with LUM are interpreted as external contextual associations rather than causal effects. The study addresses three questions. First, how does LUM vary across 250m, 500m, and 750m station area radii? Second, how is LUM related to land use composition, and how is it externally associated with station ridership, land cost, workers, residents, and transport service variables? Third, what station area types emerge from the combined interpretation of LUM, ridership, and composition, and what planning implications do they suggest?
2. Literature Review
2.1. Land Use Mix and Its Interpretive Ambiguity
The concept of land use mix is closely linked to transit oriented development theory and built environment research. Classic TOD arguments emphasize that transit stations are not only transport facilities but also places where density, functional diversity, pedestrian design, and accessibility interact [4]. Within the node-place tradition, station areas are evaluated by both transport supply and surrounding urban intensity [5,6], and LUM can be interpreted as part of the place dimension. The usefulness of LUM nevertheless depends on how it is interpreted. Entropy based LUM, adapted from Shannon entropy in a tradition traced to Cervero’s work on suburban land use and travel and extended by Frank and Pivo [7,8], compresses several land use categories into a single value. That value captures balance but does not identify which categories are balanced. Simulation studies comparing alternative land use mix measures have shown that their values are sensitive to both the number of land use categories included and the spatial scale of analysis [9]. Two station areas may receive similar values even when one is commercial-residential and the other industrial-residential-green. A further ambiguity occurs when LUM is treated as a cause. Because LUM is calculated from land use shares, the broad land use shares used here should not be described as external determinants of LUM. This is a specific instance of a broader problem in compositional data analysis, when variables are parts of a whole that sums to a constant, their correlations with any quantity derived from that whole are structurally induced rather than freely estimated [10]. Interaction based mixed-use indices have been proposed partly to avoid this circularity [11]. Thus, this study uses composition variables strictly for compositional interpretation and reserves the language of association for variables external to the formula.
2.2. Causal Ambiguity and the Multi Radius Problem
LUM could be read both as an explanatory variable for travel behavior and as an outcome of urban development processes shaped by accessibility, land prices, zoning, redevelopment pressure, and historical accumulation. This two way relationship makes causal interpretation difficult in cross sectional data, paralleling the residential self selection debate in which associations between neighborhood characteristics and travel outcomes have proven hard to interpret causally [12,13]. A positive association between LUM and ridership does not establish whether mixed land use raises ridership, whether highly used stations attract mixed development, or whether both follow from centrality, land value, or employment concentration. This research therefore uses the terms association, correlate, and diagnostic interpretation throughout. The spatial definition of a station area is a second source of ambiguity. Buffer distances commonly approximate walking catchments [1], but each radius captures a different layer of urban structure and LUM is sensitive to which distance is chosen [9]. A large sample comparison of US transit stations found that while different catchment radii make little difference to ridership prediction, the appropriate catchment differs by planning purpose, with narrower buffers better suited to employment related policy and wider buffers to population related policy [14]. Evidence that pairing land use and node-place indicators with a walkability based accessibility measure can change how a station area is classified points in the same direction [15]. A multi radius design is therefore preferable to selecting a single buffer as the correct station area.
3. Data and Methods
3.1. Data, Unit of Analysis, and Sample Coverage
The study uses a Seoul urban railway station, area dataset combining station indicators, ridership, land value, place variables, transport service variables, and parcel-based land use mix indicators for the 2023 reference year, compiled from publicly available open government data on land use and station area statistics. The empirical unit is the station line observation, because several Seoul stations are served by more than one line and line specific functions may differ even when station names are shared. Results should therefore be read as a station and line analysis rather than a unique physical station analysis. The source dataset contains 324 station-line observations. LUM values are available for 245 of these and broad composition variables for 231, because parcel level land use coverage is incomplete for a subset of stations, concentrated among more recently opened lines. The remaining observations retain coverage across all 25 autonomous districts of Seoul, so the reduction does not restrict the analysis to a particular part of the city. Each radius carries a distinct interpretive role rather than serving as an interchangeable alternative, 250m for the station front environment, 500m for the walkable neighborhood, and 750m for wider urban structure.
3.2. LUM Indicator and Variable Groups
The main indicator is the LUM value in the station area dataset. Conceptually the index follows normalized land use entropy [7,8], and values near zero indicate dominance by one category, and the values near one indicate a more balanced distribution. For each station area buffer, LUM is calculated using the normalized Shannon entropy formulation (Eq. 1):
| (Eq. 1) |
where pi is the areal share of land use category i within the buffer, and k is the number of land use categories with non-zero area. When only one category is present (k=1), LUM is defined as 0. The normalized index therefore ranges from 0 (single-use dominance) to 1 (an even distribution among the categories present) [7~9].
Variables are grouped by their role in the analysis rather than by conventional dependent-independent status (Table 1.). Composition variables are used to characterize the broad land use structure associated with observed LUM values rather than as independent causes of the index. External correlates are not mathematical components of LUM and describe the conditions under which particular LUM patterns appear. Ridership is not treated as a dependent variable but as one dimension of station area activity, and land cost is read as a proxy for locational advantage consistent with bid-rent accounts of urban land value [16] and with evidence that station proximity premiums vary by distance band [17]. Workers and residents distinguish employment centered from residential access areas, echoing the jobs and housing balance [18].

Variable groups and interpretation used in the LUM diagnostic framework
3.3. Analytical Procedure
The analysis proceeds in four steps. First, LUM is interpreted through its relationship with broad land use composition shares at each radius. Second, LUM is compared with external correlates by using Pearson correlations for linear association and Spearman correlations for monotonic rank relationships, a dual approach appropriate because ridership, land cost, workers, and residents are unevenly distributed across Seoul. Third, cross validated ridge models compare transport only, place only, economic only, composition only, and combined context specifications. Ridge regression reduces overfitting when predictors are correlated and samples are moderate, and results are read as diagnostic comparison rather than causal evidence. Because sample sizes differ across feature sets, the comparison is always interpreted together with reported n values. Fourth, representative station cases connect the statistical results to recognizable station area types, following interpretive and classification based approaches to station area differentiation [19~21].
4. Results
4.1. Multi Radius Structure of LUM
The results first demonstrate that LUM is inherently radius specific. The 250m radius captures station front conditions, where commercial frontage and immediate access environments are most visible. The 500m radius captures the transition from station frontage to the walkable neighborhood. The 750m radius captures the wider urban structure in which residential, employment, industrial, commercial, and green patterns become more apparent. Several case profiles illustrate this multi-radius logic. Gangnam and Yeoksam show relatively high LUM at 250m and remain mixed at wider radii, although their residential shares increase as the radius expands. Sillim and Yeonsinnae show a more pronounced decline from high station-front LUM to lower wider-radius LUM, indicating that immediate commercial activity is absorbed into broader residential dominance. These stations should not be described simply as high-LUM commercial centers at all scales. They are better understood as station-front commercial mixed centers whose wider catchments become increasingly residential.
Other stations show the opposite pattern. Dorimcheon has a 250m LUM value of zero but increases to 0.474 at 500m and 0.665 at 750m. This indicates that the immediate station area is not mixed, but broader radii incorporate industrial, residential, and green components that raise mixedness. Such a case would be misread if only the 250m radius were used. It is not a uniformly low LUM green-edge station, it is a radius expanding mixed edge case.
4.2. Compositional Interpretation of LUM
The strongest relationships appear between LUM and broad land use composition (Table 2., Fig. 1., Fig. 2.). This is expected because LUM is derived from land use distribution, but the result identifies which categories are associated with variation Seoul station area LUM. Residential dominance tends to reduce LUM, while commercial and industrial shares are positively associated with LUM when they participate in a more balanced composition. Commercial share has a strong positive monotonic relationship with LUM at all radii, with Spearman correlations of 0.713, 0.664, and 0.699 at 250m, 500m, and 750m. The interpretation must be precise: the result does not mean that more commercial land always raises LUM. If commercial land completely dominates a buffer, LUM can be low because the area is effectively single-use, as Euljiro 1-ga and Jonggak show. The result means that, across Seoul station-front areas, commercial presence often appears together with other uses and weakens single-use residential dominance.
Correlations between LUM and all analyzed variables by radius (Pearson r/Spearman ρ)
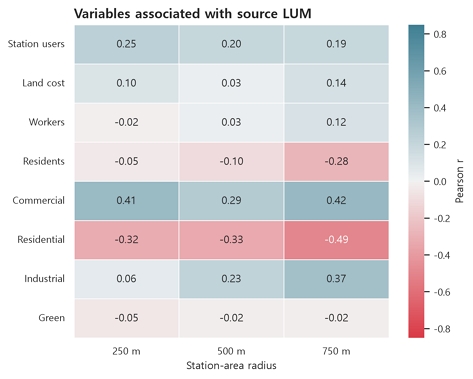
Variables associated with LUM by radius
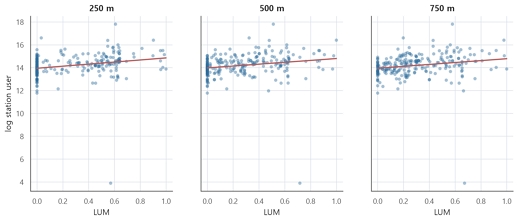
LUM and station ridership by station-area radius
Residential share shows the opposite tendency, and the negative relationship strengthens with radius, moving from a Pearson correlation of -0.321 at 250m to -0.492 at 750m. As the broader catchment becomes more residentially dominant, land use balance decreases. This should not be read as a negative judgment of residential station areas as it indicates that many Seoul station areas perform a residential access role at wider scales, so their low LUM reflects functional specialization rather than planning failure.
Industrial share contributes mainly at broader radii, with a Pearson correlation of 0.368 at 750m. This prevents the analysis from equating mixedness with commercial use alone. In Seoul, older industrial and employment districts such as Yeongdeungpo, Guro, and Sindorim contain industrial parcels, office conversions, residential neighborhoods, support retail, and redevelopment sites, so their high LUM reflects historically layered industrial-employment mixing rather than a retail-centered station front. Green share correlates near zero with LUM across radii but carries different meanings case by case: in Namtaeryeong a high green share accompanies very low LUM under spatial constraint, whereas in Dorimcheon green land combines with industrial and residential land at wider radii to produce a more mixed profile.
4.3. External Correlates of LUM
Station ridership is positively associated with LUM across all radii, but modestly relative to the composition relationships. Pearson correlations are 0.248, 0.204, and 0.195 at 250m, 500m, and 750m, while the corresponding Spearman correlations are higher at 0.386, 0.364, and 0.349. Higher-use stations tend to have higher LUM in rank terms, but the linear association is not strong enough to support a deterministic reading. This is consistent with evidence that metro ridership is shaped jointly by land use, station design, and network position rather than by any single built environment variable [22], and that density and demand factors together tend to be the strongest correlates of fixed guideway ridership [23].
Land cost has a positive but weak relationship with LUM, with a Pearson correlation of 0.138 at 750m, cautioning against treating LUM as an expression of land-market intensity. Workers show a small positive association at 750m while residents show a clearer negative one (-0.285 by Pearson), consistent with the compositional finding that wider residential dominance lowers LUM. Transport-service variables are weaker and mixed: subway frequency is positively associated with LUM in rank terms, bicycle parking is inconsistent, and public parking is positive at 750m by Pearson but weaker by rank. Local access infrastructure is part of station-area context but does not independently define mixedness. LUM is therefore related to station-area activity and context but is not reducible to any single external variable.
4.4. Model-Based Comparison of Variable Domains
The ridge comparison asks whether LUM is better summarized by one domain of variables or by a broader contextual specification (Table 3.). At 250m, the combined-context model reaches the highest cross validated R2 at 0.197, while composition-only reaches 0.076 and single-domain external models perform near or below zero. Immediate station-front LUM is evidently sensitive to local block structure, entrance location, and frontage conditions that broad station-area variables do not capture. At 500m, overall performance is weakest, with a combined-context R2 of 0.106. This radius appears transitional, broader than the station front but not yet wide enough for external variables to explain LUM strongly. At 750m, performance improves, with a combined-context R2 of 0.271 and composition-only R2 of 0.246. The small gap between the two specifications at 750m should be read carefully. It would be too strong to claim that external context decisively outperforms composition. The result shows that composition is a substantial part of the LUM structure, as expected, and because the specifications use different sample sizes, their small performance gap should be interpreted descriptively rather than as an incremental gain from adding external variables. This supports the two-step interpretation rather than replacing it with a single predictive explanation.
Cross-validated ridge model comparison for LUM (CV R2/CV MAE)
The composition-only and economic-only models use complete records for their respective predictor domains (n=231 and n=237). The combined-context model retains all 245 observations with non-missing source LUM by applying median imputation to missing predictor values within each training fold. Thus, n=245 in the combined model denotes the available outcome sample after model-specific preprocessing rather than complete observations for every predictor. Because the estimation samples differ across specifications, cross-validated performance is compared descriptively rather than interpreted as a strict incremental test. In addition, part of the observed difference in model performance may reflect differences in sample composition and data availability rather than predictor-domain effects alone.
4.5. Station-Area Typology and Case Interpretation
Similar LUM values can emerge from different land use structures, and different values can coexist with similar ridership levels. Seven interpretive types are proposed from combinations of LUM, ridership, composition, and radius specific change (Table 4., Fig. 3., Fig. 4., Fig. 5.). Three patterns are worth highlighting.
Interpretive station-area typology
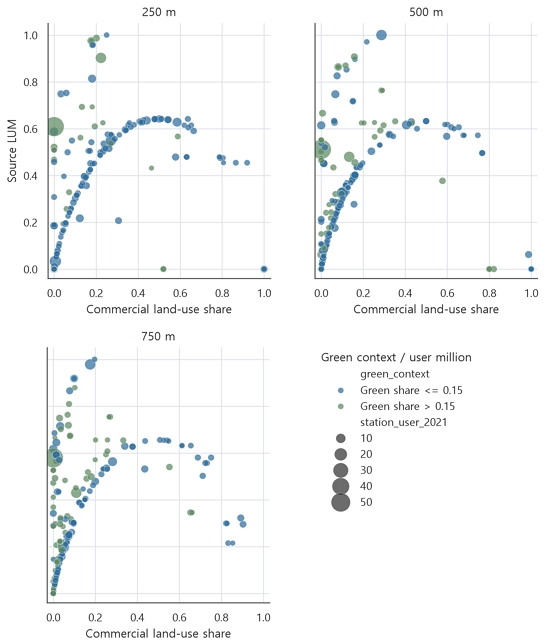
Commercial land use share, LUM, and station-user scale by radius, distinguishing station areas with green share above and below 0.15
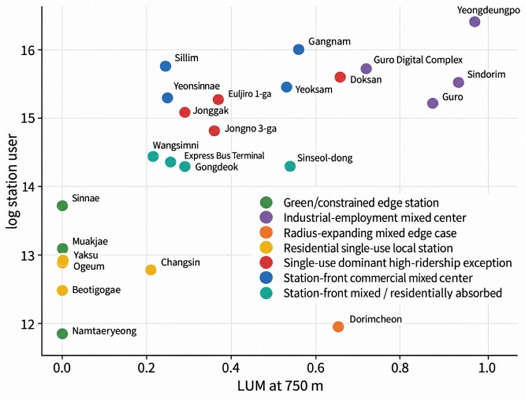
Representative station-area cases positioned by 750m LUM and station-user scale
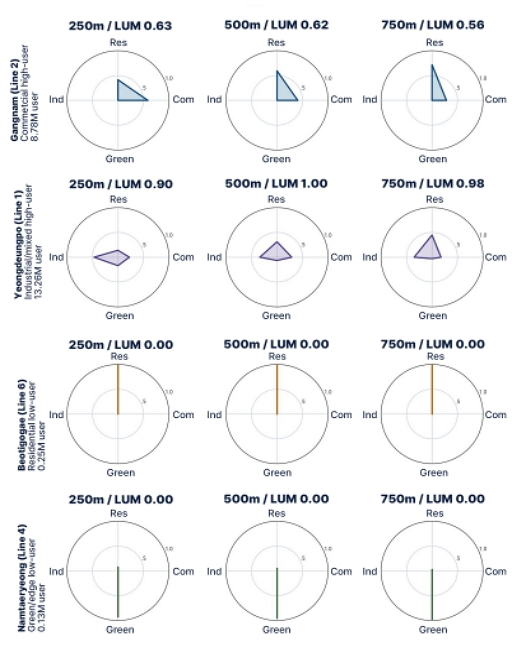
Multi-radius radar profiles of selected station-area land use composition
First, station front mixedness is frequently absorbed into residential dominance at wider radii. Gangnam records 8.78 million annual users with LUM of 0.628, 0.616, and 0.563 across radii, while its commercial share falls from 0.586 to 0.282 and residential share rises from 0.414 to 0.718. Wangsimni shows this more sharply, with LUM declining from 0.576 to 0.218 as residential share rises from 0.746 to 0.934. These are commercial station-front centers, not uniformly high-LUM areas. Second, high ridership does not require high mixedness. Euljiro 1-ga and Jonggak have very low 250m LUM because commercial land dominates rather than balances, yet their passenger volumes are large, produced by centrality and network role. Conversely, Yeongdeungpo combines very high LUM across radii (0.902, 1.000, 0.978) with 13.26 million annual users through layered industrial, commercial, residential, and green components. Third, low LUM at the station front does not imply a uniformly unmixed catchment. Dorimcheon records zero LUM at 250m but 0.474 at 500m and 0.665 at 750m as its green share falls from 0.692 to 0.331 and industrial and residential shares become visible. Read at a single radius, this station would be misclassified as a green-edge low-LUM case. By contrast, Beotigogae, Yaksu, and Ogeum have LUM of zero at all three radii with residential shares of one, and Namtaeryeong has green shares above 0.925 with LUM of zero throughout. These are genuinely specialized station areas, and the appropriate planning question is access quality rather than commercial intensification.
5. Discussion
5.1. LUM as a Diagnostic Indicator
The results support reading LUM as a diagnostic indicator rather than a universal performance score. A high value does not always indicate a desirable condition and a low value does not always indicate failure. The relevant question is what kind of land use structure exists around a station and how it changes by radius. This matters because station areas perform different urban roles. A commercial high-LUM station may require management of pedestrian congestion, public space, and transfer convenience. An industrial employment mixed station may require redevelopment coordination and pedestrian permeability across large blocks. A residential low LUM station may require safer walking routes and better local bus integration rather than forced commercial intensification. A green-edge station may require ecological sensitivity and safe access under topographical constraint. A framework that treats LUM as universally positive risks favoring commercial and employment centered stations while undervaluing residential or environmentally constrained ones.
5.2. The Conditional Relationship Between LUM and Ridership
The LUM ridership relationship is positive but conditional. High ridership stations tend to be more mixed, yet the correlations are modest relative to the composition relationships, and ridership also reflects network position, line role, transfer function, employment access, and residential catchment. The cases sharpen that Gangnam and Yeongdeungpo are both high ridership and high LUM but for different reasons, while Euljiro 1-ga and Jonggak achieve high ridership with low immediate LUM. Mixedness produced by commercial-residential balance near entrances may relate more directly to pedestrian activity than mixedness produced by green and industrial coexistence at the urban edge. The defensible conclusion is not that LUM increases ridership but that LUM indicates a potential activity structure whose effect depends on transport and urban context[12,13].
5.3. Radius Specific Interpretation and Methodological Implications
The multi radius design is a methodological contribution rather than a sensitivity test, because each radius answers a different planning question. The 250m radius is most relevant to station front planning, such as pedestrian space, entrance environment, frontage diversity, and transfer convenience. The 500m radius indicates whether station-front mixedness extends into the walkable neighborhood or remains confined. The 750m radius is essential for distinguishing residential local stations, industrial-employment mixed centers, and green-constrained edges, since both the negative residential association and the positive industrial association are strongest at this scale. The main methodological implication is that LUM analysis must distinguish internal components from external correlates, consistent with the principle that parts of a closed composition should not be modeled as free standing causes of a quantity derived from that composition [10]. The model comparison reinforces this: single domain external specifications explain LUM poorly, composition only models are meaningful especially at 750m, and the combined context and composition only models both perform relatively strongly at 750m, although their difference is interpreted descriptively because sample sizes differ. LUM is mathematically tied to composition, but the planning meaning of that composition depends on ridership, land value, employment, residents, and transport service.
5.4. Limitations
Several limitations should be acknowledged. First, the results represent contemporaneous associations rather than temporal or causal relationships. Because the analysis relies on cross-sectional data, it cannot establish whether changes in accessibility precede changes in land use mix, whether land use change occurs before changes in ridership or accessibility, or whether these processes evolve simultaneously. Future longitudinal or quasi-experimental studies could examine these temporal relationships more directly [13].
Second, differences in data availability result in unequal analytical samples across variables and model specifications. Broad composition variables are available for 231 observations, land cost for 237, and source LUM and several external variables for 245. Accordingly, differences in correlation or predictive performance may partly reflect variation in sample composition as well as differences among predictor domains. Future analyses using a common complete-case sample or harmonized data coverage would provide a more controlled robustness check.
Third, the station-line structure of the dataset may introduce repeated transfer station environments. Although line specific observations preserve differences in ridership and transport service conditions, multiple lines serving the same physical station can share substantially the same surrounding land use context. Future studies could examine the stability of the findings using physical station aggregation, station-level weighting, or validation procedures that group observations by station.
Fourth, LUM values remain sensitive to the definition and aggregation of land use categories. Alternative classification schemes may therefore produce different levels of measured mixedness[9]. In addition, because the broad entropy measure is normalized by the number of broad categories present within each buffer, a balanced two category area and a balanced four category area can receive comparable broad LUM values. The index should therefore be interpreted together with the underlying composition rather than as a stand alone measure of functional diversity.
Finally, the seven station-area types should be understood as a diagnostic typology rather than a statistically estimated classification. The types were developed to synthesize recurring combinations of LUM, ridership, land use composition, and radius specific change observed in the case profiles. Future research could test the reproducibility of this framework using clustering, latent-class analysis (LCA), or other data-driven classification methods and assess its external validity across additional station samples [19~21].
6. Conclusion
This study reinterpreted land use mix in Seoul metro station areas as a multi radius compositional diagnostic indicator, distinguishing internal land use composition from external station area correlates. LUM is more strongly associated with composition than with ridership alone. At 750m, residential share is clearly negative while commercial and industrial shares are positive, indicating that wider radius LUM in Seoul depends on whether residential dominance is weakened and whether activity or employment related categories enter the catchment. Commercial dominance can also produce low LUM when it becomes single-use, as central high ridership exceptions show. LUM therefore depends on the balance and dominance structure among categories rather than on any one category mechanically raising the index. Combined contextual models explain LUM better than single domain models, but composition only models remain meaningful, particularly at 750m. The contribution is a two step framework. The study interprets LUM in relation to broad land use composition and then interprets it against external station area context. This avoids circular explanation and prevents LUM from being used as a universal performance score. For Seoul metro station areas, the planning value of LUM lies not in ranking stations by mixedness but in revealing what kind of station-area structure each place represents.
Acknowledgments
This work was supported by the InnoCORE program of the Ministry of Science and ICT (N10260092).
References
-
R. Cervero, K. Kockelman, Travel demand and the 3Ds: Density, diversity, and design, Transportation Research Part D, 2(3), 1997.09, pp.199-219.
[https://doi.org/10.1016/S1361-9209(97)00009-6]

-
R. Ewing, R. Cervero, Travel and the built environment: A meta-analysis, Journal of the American Planning Association, 76(3), 2010.06, pp.265-294.
[https://doi.org/10.1080/01944361003766766]
-
H. Sung, J.T. Oh, Transit-oriented development in a high-density city: Identifying its association with transit ridership in Seoul, Korea, Cities, 28(1), 2011.02, pp.70-82.
[https://doi.org/10.1016/j.cities.2010.09.004]
- P. Calthorpe, The next American metropolis: Ecology, community, and the American dream, New York: Princeton Architectural Press, 1993.
-
L. Bertolini, Nodes and places: Complexities of railway station redevelopment, European Planning Studies, 4(3), 1996.06, pp.331-345.
[https://doi.org/10.1080/09654319608720349]
-
L. Bertolini, Spatial development patterns and public transport: The application of an analytical model in the Netherlands, Planning Practice & Research, 14(2), 1999.05, pp.199-210.
[https://doi.org/10.1080/02697459915724]
- R. Cervero, America’s suburban centers: The land use-transportation link, London: Unwin Hyman, 1989.
- L.D. Frank, G. Pivo, Impacts of mixed use and density on utilization of three modes of travel: Single-occupant vehicle, transit, and walking, Transportation Research Record, 1466, 1994, pp.44-52.
-
Y. Song, L. Merlin, D. Rodriguez, Comparing measures of urban land use mix, Computers, Environment and Urban Systems, 42, 2013.11, pp.1-13.
[https://doi.org/10.1016/j.compenvurbsys.2013.08.001]
-
J. Aitchison, The Statistical Analysis of Compositional Data, London: Chapman & Hall, 1986.
[https://doi.org/10.1007/978-94-009-4109-0]
-
K. Manaugh, T. Kreider, What is mixed use? Presenting an interaction method for measuring land use mix, Journal of Transport and Land Use, 6(1), 2013, pp.63-72.
[https://doi.org/10.5198/jtlu.v6i1.291]
-
S. Handy, X. Cao, P.L. Mokhtarian, Correlation or causality between the built environment and travel behavior? Evidence from Northern California, Transportation Research Part D, 10(6), 2005.11, pp.427-444.
[https://doi.org/10.1016/j.trd.2005.05.002]
-
X. Cao, P.L. Mokhtarian, S.L. Handy, Examining the impacts of residential self-selection on travel behavior: A focus on empirical findings, Transport Reviews, 29(3), 2009.05, pp.359-395.
[https://doi.org/10.1080/01441640802539195]
-
E. Guerra, R. Cervero, D. Tischler, The half-mile circle: Does it best represent transit station catchments?, Transportation Research Record, 2276, 2012, pp.101-109.
[https://doi.org/10.3141/2276-12]
-
D.S. Vale, Transit-oriented development, integration of land use and transport, and pedestrian accessibility: Combining node-place model with pedestrian shed ratio to evaluate and classify station areas in Lisbon, Journal of Transport Geography, 45, 2015.05, pp.70-80.
[https://doi.org/10.1016/j.jtrangeo.2015.04.009]
-
W. Alonso, Location and land use: Toward a general theory of land rent, Cambridge: Harvard University Press, 1964.
[https://doi.org/10.4159/harvard.9780674730854]
-
G. Debrezion, E. Pels, P. Rietveld, The impact of railway stations on residential and commercial property value: A meta-analysis, The Journal of Real Estate Finance and Economics, 35(2), 2007.08, pp.161-180.
[https://doi.org/10.1007/s11146-007-9032-z]
-
R. Cervero, Jobs-housing balance revisited: Trends and impacts in the San Francisco Bay Area, Journal of the American Planning Association, 62(4), 1996.12, pp.492-511.
[https://doi.org/10.1080/01944369608975714]
-
D.E. Reusser et al., Classifying railway stations for sustainable transitions: Balancing node and place functions, Journal of Transport Geography, 16(3), 2008.05, pp.191-202.
[https://doi.org/10.1016/j.jtrangeo.2007.05.004]
-
M. Kamruzzaman et al., Advance transit oriented development typology: Case study in Brisbane, Australia, Journal of Transport Geography, 34, 2014.01, pp.54-70.
[https://doi.org/10.1016/j.jtrangeo.2013.11.002]
-
C.D. Higgins, P.S. Kanaroglou, A latent class method for classifying and evaluating the performance of station area transit-oriented development in the Toronto region, Journal of Transport Geography, 52, 2016.04, pp.61-72.
[https://doi.org/10.1016/j.jtrangeo.2016.02.012]
-
J. Zhao et al., What influences metro station ridership in China? Insights from Nanjing, Cities, 35, 2013.12, pp.114-124.
[https://doi.org/10.1016/j.cities.2013.07.002]
-
E. Guerra, R. Cervero, Cost of a ride: The effects of densities on fixed-guideway transit ridership and costs, Journal of the American Planning Association, 77(3), 2011.07, pp.267-290.
[https://doi.org/10.1080/01944363.2011.589767]