
Urban Green Infrastructure Network Planning for Future Sustainability Goals : A Historical Analysis and Multi-Scenario Simulation Based on the Case of Seoul
ⓒ 2026. KIEAE all rights reserved.
Abstract
This study aims to explore how high-density urban development interacts with the evolution of green infrastructure networks and to examine how different future policy pathways may reshape ecological connectivity in Seoul.
This study uses land-use/land-cover data for 2000, 2010, and 2020 in Seoul and integrates the PLUS model, Morphological Spatial Pattern Analysis (MSPA), and circuit theory to analyze the spatiotemporal evolution of the green infrastructure (GI) network and to simulate its differential responses under four 2040 scenarios: NDS, UDS, EPS, and BDC. Ecological sources, corridors, pinch points, and barrier points were identified, while network performance was assessed using static centrality indicators and dynamic resilience tests under random and intentional disturbances.
The results show that from 2000 to 2020, built-up land in Seoul increased from 57% to 60%, while ecological land continuously contracted. The GI network exhibited a high-cost maintenance pattern of connectivity, with increasing source fragmentation, rising resistance surfaces, and concentrated connectivity risks. Under the 2040 scenarios, NDS, UDS, and BDC continued compensatory connectivity, whereas EPS improved structural optimization through source integration and resistance restoration, but showed stronger core-node dependence and lower robustness under intentional attacks.
Keywords:
Green Infrastructure Network, Landscape Connectivity, Multi-Scenario Simulation, Urban Sustainable Development1. Introduction
Against the backdrop of rapid global urbanization, urban land-use patterns have undergone profound transformations [1]. While the intensive expansion of built-up land and spatial agglomeration have enhanced urban economic vitality and service efficiency, they have also altered the spatial structure and functional processes of existing ecosystems [2]. This transformation has resulted in a series of ecological challenges, including the reduction of natural habitats, increased fragmentation of ecological patches, and the degradation of landscape connectivity [3]. These changes further affect the provision capacity of ecosystem services, thereby increasing the uncertainty faced by cities in responding to climate change, biodiversity loss, and environmental risks [4]. Consequently, an important challenge is how to coordinate land-use development with ecosystem conservation in the context of high-density urban development [5].
As an important approach to addressing urban ecological challenges, green infrastructure (GI) is widely recognized as a nature-based solution [6]. By integrating natural patches, semi-natural spaces, and ecological corridors within urban areas, GI supports ecological processes across multiple spatial scales and enhances the provision of ecosystem services [7]. Unlike traditional planning approaches that focus on individual green spaces or isolated ecological patches, GI emphasizes systemic and networked structures, highlighting the spatial connectivity among ecological elements and their overall functional performance [8]. In recent years, a research paradigm characterized by source identification–resistance surface construction–corridor simulation has gradually taken shape [9]. Regarding source identification, one category of approaches directly extracts ecological sources from ecological land-use types. However, this method is highly subjective and does not adequately consider structural and functional attributes [10]. Another approach involves evaluating ecological elements and extracting sources based on specific research objectives. Morphological Spatial Pattern Analysis (MSPA) is a representative method in this category [11]. Owing to its advantages of accessible data and high identification accuracy, MSPA has become a commonly used tool for long-term studies [12]. Nevertheless, many of these studies tend to overlook the scale effects of ecological sources, and the determination of thresholds often remains overly subjective. Recent studies have proposed sensitivity analysis as a new approach to address this issue. Resistance surfaces are typically constructed by selecting relevant factors based on the characteristics of the study area and the specific research objectives, followed by weighted overlay to generate a composite resistance surface [13]. In highly urbanized regions, land-use patterns directly reflect urban development processes and thus constitute a key factor in resistance surface construction [14]. In terms of corridor identification, the Minimum Cumulative Resistance (MCR) model has been widely applied. However, this model suffers from limitations such as redundant corridor identification and an inability to detect critical nodes [15]. By contrast, circuit theory simulates species dispersal using electrical current analogies and is capable of identifying continuous corridors, quantifying connectivity importance, and locating pinch points and barrier points, thereby becoming one of the mainstream models currently used in ecological network analysis [16,17].
The continuous advancement of methods for constructing green infrastructure networks has provided important tools for their quantitative assessment [18]. However, existing studies are predominantly based on single time snapshots or static land-use patterns and pay relatively limited attention to the uncertainties associated with future urban development [19]. In reality, land-use change exhibits significant path dependence and scenario variability. Under different development orientations, patterns of urban expansion, levels of ecological protection, and spatial governance strategies often lead to markedly different network structures and connectivity outcomes [20,21]. Therefore, evaluating GI network characteristics solely under current spatial configurations is insufficient to support long-term ecological planning and policy formulation. Multi-scenario land-use simulation provides an important approach to addressing these limitations [22]. By constructing different development scenarios and simulating the corresponding processes of land-use change, it becomes possible to systematically depict multiple potential pathways of future urban spatial evolution and further evaluate the varying structural and functional performance of ecosystems under different scenarios [23,24]. In recent years, scenario-based prediction studies grounded in Cellular Automata (CA), Markov chains, and new-generation land-use simulation models have continued to advance, making it possible to analyze the potential impacts of land-use change on ecosystems over medium- to long-term temporal scales. In addition, the dynamic evolution patterns of green infrastructure networks during historical periods still require further clarification [25,26]. This is particularly important in the context of high-density metropolitan areas, where the conflict between the expansion of built-up land and the compression of ecological space is more pronounced. Clarifying these historical evolutionary characteristics and revealing the interaction mechanisms between human activities and ecological systems can not only provide historical references for optimizing the spatial configuration and risk prevention of GI networks under future scenarios, but also enhance the interpretability and transferability of planning recommendations [27].
Against this background, promoting a research paradigm oriented toward “future sustainability goals” can facilitate the transition of GI network studies from static assessment to dynamic simulation and optimization-oriented decision-making. As a typical high-density metropolis, Seoul’s urban development trajectory vividly reflects the complex tensions among rapid urbanization, highly constrained land resources, and the protection of ecological space [28]. First, constrained by topographic conditions and the existing built environment, Seoul has limited space for outward urban expansion. Second, the city has placed increasing emphasis on ecological security, residents’ well-being, and sustainable development, making it an ideal case for examining the relationship between multi-scenario land-use change and GI network optimization. Accordingly, this study takes Seoul as the study area to examine the evolutionary characteristics of the green infrastructure (GI) network from 2000 to 2020 in terms of quantity, area, and structural configuration, and to evaluate its differential responses and potential risks under different future development scenarios. First, it focuses on how the GI network evolved over time under high-density urban development. Second, it compares the structural responses and connectivity differences of the network across multiple future scenarios. Third, it discusses how urban development policies have shaped the long-term trajectory of GI network evolution and what implications these dynamics may generate for future ecological planning.
In particular, the study pays close attention to whether continued urban expansion is associated with the fragmentation of ecological sources, increasing ecological resistance, and the emergence of compensatory connectivity characteristics. It also examines whether the ecological priority scenario can improve network integrity and connectivity more effectively than development-oriented pathways, and whether structural optimization is necessarily accompanied by enhanced resilience. In doing so, the study further emphasizes the role of urban policy in reshaping land-use transition pathways and the long-term dynamics of the GI network.
2. Literature Review
The construction of green infrastructure networks is an important component of current research on ecological security patterns, and its core lies in ecological source identification, ecological resistance surface construction, ecological corridor simulation, and the evaluation of network structure and function [29]. Green infrastructure network planning typically involves three core procedures, including the identification of ecological source areas, the establishment of resistance surfaces, and the delineation of ecological corridors [30]. Ecological sources are mainly identified through the following four approaches. First, natural reserves, forest parks, or green spaces are directly selected as ecological sources. Although this approach is somewhat subjective, This method is comparatively straightforward to apply. In densely built environments with limited ecological resources, protected areas and urban parks often serve as the dominant spaces for the provision of ecosystem services, which lends a certain degree of validity to this method. Second, Morphological Spatial Pattern Analysis (MSPA) has been increasingly introduced into GI network analysis. MSPA is an image-processing approach based on mathematical morphology principles, such as erosion, dilation, opening, and closing operations, and is used to measure, identify, and segment the spatial patterns of raster images. It explains landscape morphology by classifying it into seven functional types according to morphological characteristics [31,32]. Within this classification, core patches are generally regarded as candidate ecological sources. Although this method is limited by its insufficient consideration of ecological functions. Third, an ecosystem service (ES) evaluation framework can be established based on a series of quantitative assessments of ecological processes [33]. Because the enhancement of one type of ecosystem service may come at the expense of the decline of others, complex trade-offs often exist among different functions, and such trade-offs may also shift with changes in the orientation of urban development policies. Fourth, species distribution models (SDMs), such as the Maximum Entropy model (MaxEnt), can be used to infer species distributions and identify areas of concentrated distribution by learning from species occurrence data. However, due to data limitations, it is still difficult for this method to comprehensively account for the habitat preferences of different species [34,35].
The construction of ecological resistance surfaces is generally based on the extent to which landscape units impede ecological flows, taking into account both natural topography and anthropogenic influences. In addition to land-use type, indicators such as elevation, slope, vegetation condition, and nighttime light intensity are also commonly incorporated into the evaluation framework. To reflect internal landscape heterogeneity in greater detail, some studies have further refined resistance classification by integrating composite variables such as the Remote Sensing Ecological Index [36]. For ecological corridor identification, the Minimum Cumulative Resistance (MCR) model and circuit theory are two commonly used approaches. The MCR model identifies potential pathways with the lowest cumulative cost by constructing a resistance surface, and it has been widely adopted because of its operational simplicity and broad applicability [37,38]. Circuit theory, by simulating the random walk process of biological flows, can compensate for the limitations of the MCR model in identifying the spatial extent of corridors, but it is computationally demanding, particularly in large-scale studies involving numerous core patches [39]. Therefore, the MCR model remains one of the most widely applied and mature approaches at present [40]. Nevertheless, green infrastructure networks constructed using traditional methods still commonly exhibit dispersed spatial layouts, excessive redundancy, and insufficient stability, indicating that the issue of network optimization still warrants further in-depth investigation.
3. Materials and Methods
3.1. Study Area
Seoul is located in the northwestern part of South Korea, within the central–western core region of the Korean Peninsula. As the political, economic, and cultural center of the country, it is characterized by a high level of urbanization, with a strong concentration of population and industries and intensive land development, exhibiting the typical spatial characteristics of a high-density metropolis. Within the national regional development framework, Seoul functions as both a core growth pole and a comprehensive service center. At the same time, it represents a key area for the continuous implementation of policies related to urban regeneration, spatial restructuring, and ecological governance.
Within the framework of the development objectives and spatial governance logic of the Seoul 2040 Comprehensive Plan, this study further constructs a multi-scenario land-use change simulation system. Based on the simulation results, GI network construction and evaluation are conducted to identify the evolutionary patterns of ecological sources and ecological corridors under different development pathways. This approach provides scientific support for spatial optimization and the establishment of an ecological security pattern for Seoul toward 2040.
3.2. Data Sources
Land use/land cover data for the years 2000, 2010, and 2020 were collected for this study. Population density, gross domestic product (GDP), soil type, elevation, slope, temperature, precipitation, and road networks were selected as driving factors of land-use change. Among these variables, land-use data, elevation, and slope were further used for the construction of the resistance surface. The specific sources and descriptions of these datasets are presented in Table 1.
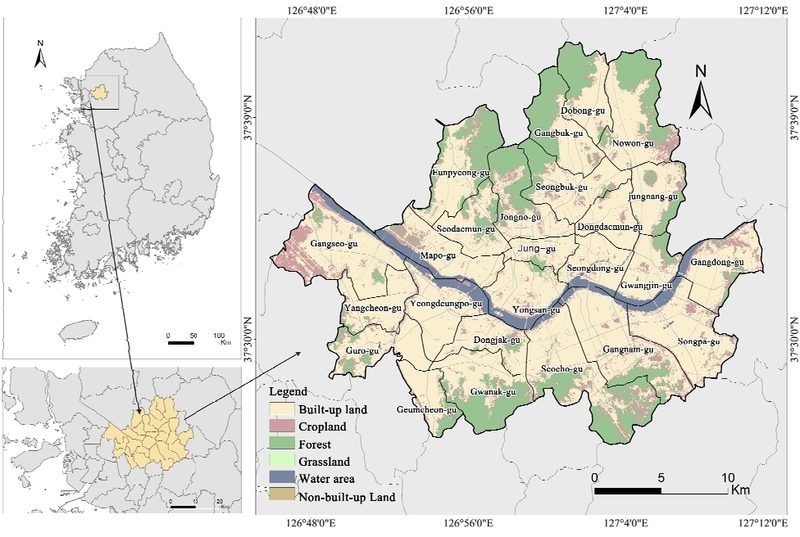
Location of the study area

Data description and sources
To ensure spatial consistency among different datasets and the reliability of the analytical results, all raster data were processed using a resampling approach to standardize the spatial resolution to 30m×30m, therebymeeting the requirements for subsequent PLUS model simulations and GI network construction.
3.3. Land-Use Simulation Method
This study first applied the Markov chain method to estimate the demand for different land-use types in 2020 and used the “Extract Land Expansion” tool to identify areas of land expansion. Subsequently, the expansion areas and the selected driving factors were jointly input into the LEAS module to calculate the development probability of each land-use type [41]. The selection of driving factors was informed by previous studies and included elevation, slope, temperature, precipitation, population density, GDP, distance to railways, expressways, primary roads, secondary roads, and tertiary roads, as well as soil type [42]. The results of the Random Forest algorithm indicated that all driving factors effectively explained the spatial variation of different land-use types, thereby validating the rationality of the selected drivers [43,44]. Regional weighting parameters were then calculated based on the scale and number characteristics of land-use patches, and the CARS module was applied to simulate the land-use pattern for 2020. By comparing the simulated results with the actual land-use data for 2020, the validation tool was used to calculate the Kappa coefficient, Overall Accuracy (OA), and the Figure of Merit (FoM) to evaluate the simulation accuracy of the model. Finally, the validated model parameters were used to predict the land-use pattern for 2040.
3.4. Scenario Settings
Based on the four future scenarios proposed in this study, scenario construction comprehensively considered the land-use characteristics of Seoul, community economic development planning, relevant previous studies, and research outcomes related to multi-scenario land-use simulation, compact cities, and shrinking cities [45~49]. The land-use transition matrix and land-use demand parameters were adjusted to establish the scenarios. The scenarios include the Natural Development Scenario (NDS), Urban Development Scenario (UDS), Ecological Priority Scenario (EPS), and Balanced Development Scenario (BDC). Detailed descriptions of each scenario are provided as follows:
(1) NDS: This scenario assumes that no additional strong planning interventions will be implemented in the future, and land-use change follows the historical transition inertia observed over the past 10~20 years. Urban development is primarily driven by existing natural geographic conditions and established development trends, reflecting a business-as-usual trajectory.
(2) UDS: This scenario corresponds to the “Beyond Zoning” and “Three-dimensional City” strategies proposed in the Seoul 2040 Comprehensive Plan. The urban development scenario emphasizes redevelopment within the existing urban footprint without expanding the total scale of built-up land. Urban development is achieved primarily through the activation, optimization, redevelopment, and upgrading of existing land resources. This is implemented by increasing the probability of converting unused land and inefficiently used land into built-up land while reducing the probability of forest land and agricultural land being occupied.
(3) EPS: This scenario corresponds to the “carbon neutrality” goal and the “waterfront-centered spatial restructuring” strategy proposed in the Seoul 2040 Comprehensive Plan. It prioritizes the ecological security pattern and emphasizes strict ecological redline control and the restoration of degraded ecosystems. This is achieved by strictly limiting the conversion of other land types into built-up land while increasing the probability of built-up land being converted into ecological land. At the same time, expansion of built-up land is restricted, and stronger protection of forest land is implemented, along with increased conversion of grassland and water bodies into forest land.
(4) BDC: Based on the natural population decline trend in South Korea and the “polycentric balanced development” strategy proposed in the Seoul 2040 Comprehensive Plan, this scenario assumes a continuous decline in the city’s total population, leading to shrinking housing and commercial demand. Under this context, policies promoting “de-densification” in core urban areas are implemented to alleviate congestion and urban heat island effects in high-density zones while promoting a more balanced spatial structure. This scenario reduces the probability of forest land, grassland, and cropland being converted into built-up land while increasing the probability of restoring unused land and certain built-up land to forest land and grassland.
3.5. GI Network Construction Method
This study employed the Morphological Spatial Pattern Analysis (MSPA) method to identify the landscape pattern of the study area [50]. According to relevant studies, forests, grasslands, and water bodies were classified as foreground pixels and assigned a value of 1, whereas built-up land, cropland, and unused land were classified as background pixels and assigned a value of 0. The MSPA method can identify seven types of landscape elements, including core areas, edges, bridges, and islets. Among these, core areas possess high structural integrity and strong ecological functions, serving as key spatial units for species survival and ecosystem service provision. Therefore, they are commonly used as the initial candidate areas for ecological sources [51].
Considering the scale requirements of ecological sources in maintaining ecological benefits and resisting external disturbances, patches with excessively small sizes were removed [52]. Specifically, the cumulative number of core patches under different area thresholds was calculated, with a step size set to 0.2km2. The growth rate of the cumulative patch number was then computed, and the threshold corresponding to the first occurrence of a growth rate of zero was determined as the optimal area threshold for ecological source identification.
Ecological corridors function as bridges within ecosystems by connecting discrete ecological patches and providing critical pathways for species migration, dispersal, and genetic exchange. In this study, the Build Network and Map Linkages module in the Linkage Mapper tool was used to identify potential ecological corridors between ecological sources based on the Minimum Cumulative Resistance (MCR) model. This method comprehensively considers the landscape resistance surface and the migration costs of species, and incorporates circuit theory to characterize the possibility of multi-path movement, thereby identifying the least-cost paths between ecological sources. The calculation formula of the MCR model is as follows:
| (Eq. 1) |
Where ƒmin represents the minimum cumulative resistance value, Dij is the spatial distance of the species from source j to target landscape i, and Ri is the resistance coefficient for migration to landscape i.
Considering the data requirements for multi-temporal GI network simulation and the actual characteristics of Seoul, this study selected land-use type, MSPA classification, elevation, and slope as factors for constructing the composite resistance surface. Each resistance factor was classified into five levels and assigned corresponding values based on relevant studies and the natural breaks method. The Analytic Hierarchy Process (AHP) was then applied to determine the weights of each factor, and a composite resistance surface was finally generated through weighted overlay. To improve methodological transparency and reproducibility, the AHP-derived weights of the resistance factors were added in Table 2.
Classification criteria and AHP-derived weights of resistance factors
This study first employed the Pinchpoint Mapper module to invoke the Circuitscape program for identifying ecological pinch points, thereby characterizing areas of concentrated ecological flow within corridors. In this study, pinch points were extracted as raster-based spatial features, and their values were summarized by total area. Subsequently, the Barrier Mapper module was used to extract ecological barrier points in order to identify key obstacle areas that significantly impede ecological connectivity. On this basis, the overall spatial response characteristics of pinch points and barrier points across different historical periods and future scenarios were compared, and a comprehensive analysis was conducted in conjunction with their spatial distribution patterns and area variation characteristics.
3.6. Structural Assessment of the GI Network
To evaluate the static structural characteristics of the ecological network, this study selected three types of static node property indicators—degree, betweenness centrality, and closeness centrality—for analysis, with the aim of identifying core nodes and their functional differences in the network from the perspectives of connection quantity, ecological flow control capacity, and accessibility efficiency. Degree is used to measure the number of direct connections between a given node and other nodes in the network. As the most fundamental and intuitive indicator of node importance, it reflects the activity level and connection capacity of a node within the local connectivity structure. Betweenness centrality is used to characterize the intermediary role played by a node in the network. Its calculation is based on the proportion of shortest paths between other pairs of nodes that pass through the given node; therefore, it can reflect the node’s capacity to control ecological flows, material transmission, and energy exchange processes. A higher value indicates that the node is more likely to function as a transmission hub within the network. Closeness centrality, by contrast, is used to measure the reciprocal of the average shortest path length from a given node to all other nodes in the network, thereby reflecting the node’s accessibility and diffusion capacity within the overall network. A higher value indicates that the node can establish connections with other nodes at lower cost and exert a stronger function of spatial diffusion within the network.
To systematically assess the structural stability and resilience of the ecological network under external disturbances, this study adopted a multi-strategy disturbance simulation approach for dynamic resistance assessment. Different attack scenarios were used to simulate the progressive failure of nodes from mild to severe disturbance levels. By gradually increasing the number of removed nodes, the relationship between disturbance intensity and network response was quantified across the full disturbance range. The proportion of the largest connected component and global efficiency retention were used to measure structural stability and functional resilience, respectively. Higher values indicate a stronger ability of the network to maintain connectivity and functional transmission under disturbance. Four attack strategies were considered. Random attack removed nodes without considering their topological importance and was used to represent non-directional disturbances such as natural disasters, dispersed green-space loss, and scattered human interference, thereby evaluating baseline network resistance. Degree-priority attack removed nodes with the highest degree first, simulating directed damage to connectivity-oriented core nodes and assessing the network’s sensitivity to structural connectivity loss. Betweenness-centrality-priority attack removed nodes with the highest betweenness centrality first, representing directed damage to transmission hubs such as key corridor intersections and evaluating the network response to disruptions in functional transmission. Closeness-centrality-priority attack removed nodes with the highest closeness centrality first, simulating disturbances to functional-radiation cores and assessing the network’s tolerance to losses in overall functional efficiency.
4. Results
4.1. Land-Use Change
To verify the reliability of the PLUS model in simulating land-use patterns in Seoul, this study compared the simulated land-use pattern for 2020 with the actual land-use data for the same year. The results indicate a high level of agreement between the simulated outcomes and the observed patterns. The Overall Accuracy reached 0.97, and the Kappa coefficient was 0.94, demonstrating that the model exhibits strong fitting capability in identifying land-use types and predicting their spatial distribution. In addition, the Figure of Merit (FoM) value was 0.378, indicating that the model has an acceptable and relatively high capability in identifying areas of land-use change.
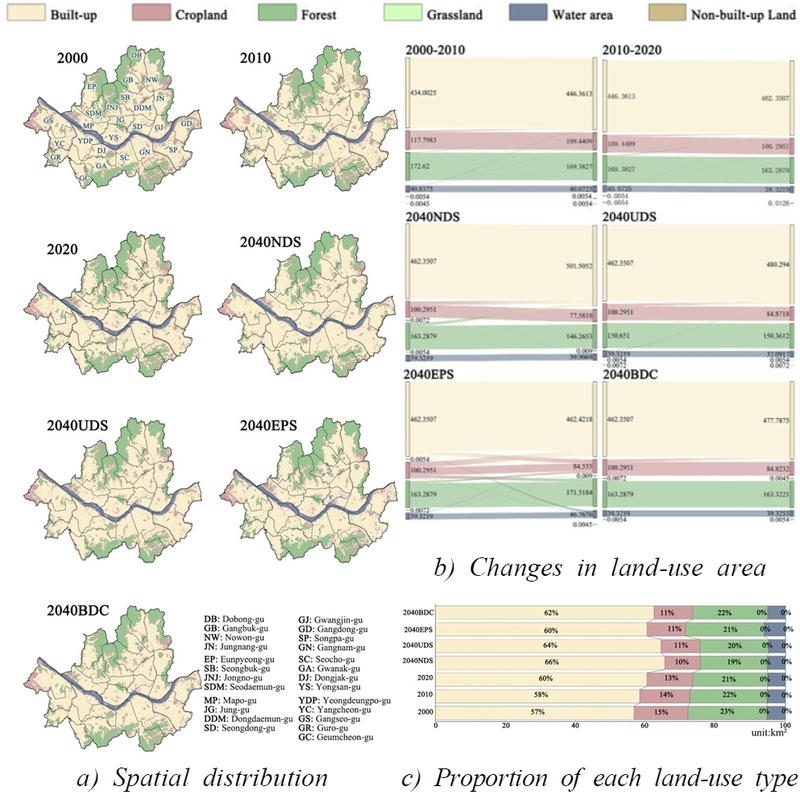
Fig. 2. a) illustrates the evolution of the land-use spatial pattern in Seoul from 2000 to 2020 and under different development scenarios projected for 2040. Between 2000 and 2020, the proportion of built-up land increased from approximately 57% to about 60%, with the area expanding from 434.00km2 to 462.35km2, indicating that Seoul remained in a state of intensive urbanization during the study period. Built-up land formed continuous development belts along both sides of the Han River and around existing urban core areas, gradually expanding toward the urban periphery. Meanwhile, forest land, the second-largest land-use type, is mainly distributed in mountainous areas and ecological control zones at the urban fringe. Its proportion gradually declined from 23% to 21% over the past two decades, with the area decreasing from 172.62km2 to 163.28km2. The decline in cropland was more pronounced, with its proportion decreasing from 15% to 13% and its area shrinking from 117.79km2 to 100.29km2, reflecting the continued encroachment of urban expansion on agricultural land. In contrast, grassland and water bodies accounted for relatively small proportions and experienced limited changes during the study period. Scenario simulation results indicate that by 2040, built-up land continues to expand under all scenarios. Urban expansion is most pronounced under the NDS and UDS scenarios, where non-built-up land at the urban fringe is continuously encroached upon. In comparison, under the EPS scenario, the continuity of ecological space is better preserved and urban expansion is significantly constrained. Under the BDC scenario, the growth of built-up land is relatively slow, and certain areas exhibit characteristics of spatial contraction.
Land use
Fig. 2. b) and Fig. 2. c) indicate that different development scenarios significantly influence the future land-use structure of Seoul. Under the NDS scenario in 2040, the proportion of built-up land increases to 66%, while forest land declines to 19%, indicating that urban expansion will continue to encroach upon ecological space in the absence of effective constraints. The UDS scenario for 2040 similarly demonstrates a strong development-oriented trend, with built-up land accounting for 64%, accompanied by further reductions in forest land and cropland. In contrast, under the EPS scenario in 2040, the expansion of built-up land is effectively restrained, with its proportion controlled at approximately 60%, remaining largely consistent with the level observed in 2020. Meanwhile, forests and grasslands maintain relatively high proportions, suggesting that an ecological-priority strategy can mitigate the compression of ecological space caused by urbanization. Under the BDC scenario in 2040, built-up land accounts for 62%, positioned between the levels observed under the UDS and EPS scenarios. Cropland and forest land are preserved to a certain extent; however, the effectiveness of expansion control is weaker than that observed under the EPS scenario. The spatial direction of built-up land expansion in Seoul is jointly constrained by farmland protection policies and road accessibility, with development activities tending to shift toward non-cropland areas. Under the EPS scenario in 2040, the scale of built-up land is effectively controlled, and the declining trends in water bodies and grasslands are significantly alleviated. This indicates that, under conditions of high urbanization, ecologically prioritized planning can effectively reduce the encroachment of urban expansion on ecological land without introducing additional assumptions.
4.2. Ecological Network
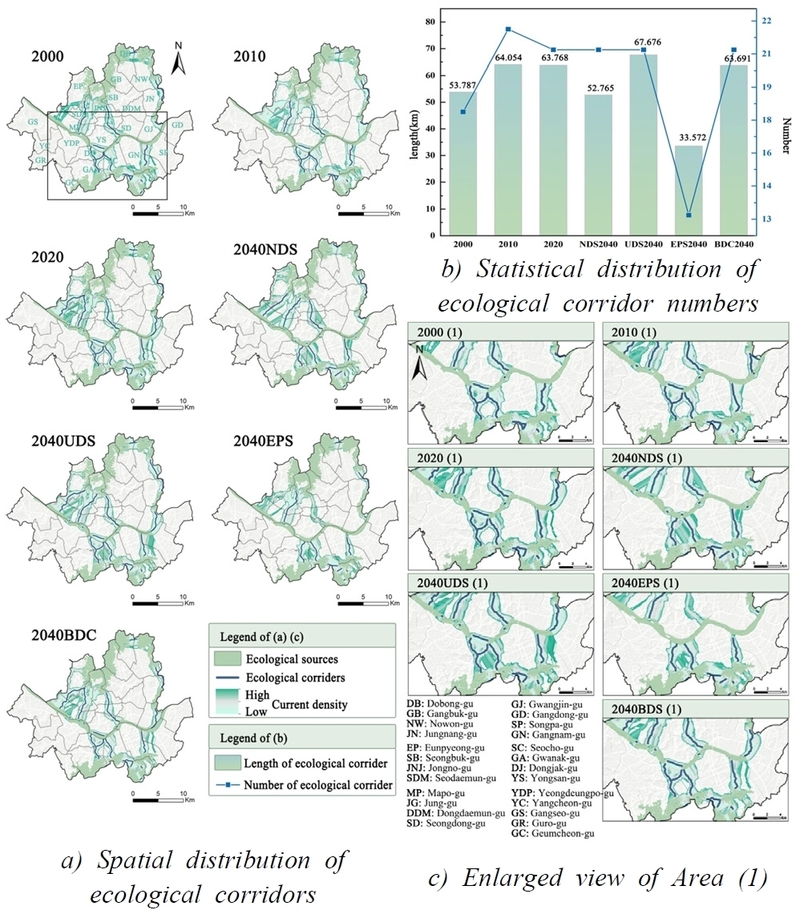
Using the identified key ecological source areas of the GI network and the composite resistance surface as the basic input data, ecological corridors were extracted and statistically analyzed using the Linkage Pathways tool in Linkage Mapper. The results show that 18 ecological corridors were identified in 2000, with a total length of 53.787km. By 2010, the number of corridors had increased to 22, and the total length had expanded to 64.054km. We infer that the simultaneous increase in corridor number and length is mainly associated with the emergence of new ecological sources and their spatial reorganization: the appearance of new source areas requires additional connecting pathways to support species migration, while the disappearance of sources in some areas may lead to a local reduction in corridors; however, the incremental effect of newly formed corridors generally outweighs the loss of those that disappeared. In 2020, the number of ecological corridors decreased slightly to 21, with a total length of 63.768km. This persistently high level reflects the continued compression of habitats by urban expansion, which has forced some corridors to detour around built-up areas, thereby increasing migration distance and energy costs.
When examining different development trajectories under the Seoul 2040 Comprehensive Plan, the scenarios exhibit markedly different connectivity characteristics. Under the Natural Development Scenario (NDS) for 2040, 21 ecological corridors were identified, with the total length decreasing to 52.765km (Fig. 3. b)). Under the Ecological Priority Scenario (EPS) for 2040, the number of ecological corridors decreases significantly to 13, and the total length drops sharply to 33.572 km, the lowest among all scenarios. Although these values decline numerically, their ecological implications are positive compared with the NDS scenario in 2040: owing to the effective integration and expansion of ecological sources under the EPS scenario, previously scattered patches become connected into larger continuous units, thereby eliminating the dependence on long-distance, high-cost migration corridors. This confirms that migration distances are substantially shortened and that ecological restoration is most effective under the EPS scenario.
Ecological corridors
In contrast, under the Urban Development Scenario (UDS) for 2040, the number of ecological corridors remains high at 21, while the total length reaches 67.676km, the highest level in the historical record. This occurs because the expansion of built-up land further compresses species habitats, resulting in the continued fragmentation of ecological sources and forcing species to rely on complex long-distance corridor networks for movement and exchange. This confirms that the UDS scenario exacerbates ecosystem vulnerability and maintains high migration resistance costs. The Balanced Development Scenario (BDC) for 2040 exhibits a similar pattern, with 21 corridors and a total length of 63.691km, likewise undermining ecological sustainability. From the perspectives of spatial distribution and ecological flow density (current density) (Fig. 3. a) and Fig. 3. c)), high-density long ecological corridors are mainly concentrated in the mountainous areas at the urban fringe of Seoul—such as Dobong-gu (DB) and Gangbuk-gu (GB) in the north, and Seocho-gu (SC) in the south—as well as along the Han River corridor running through the city center. Among these, the corridor density is highest in the area where the southern peripheral mountains intersect with the Han River basin, and the morphological changes there are more pronounced under different future scenarios (Fig. 3. c)). This indicates that these areas constitute the core hubs of intensive north–south ecological flows in Seoul and are highly susceptible to high-intensity human development activities. Therefore, in implementing the comprehensive urban plan, particular attention should be paid to the protection and restoration of the ecological network in this hub area.
4.3. Ecological Pinch Points
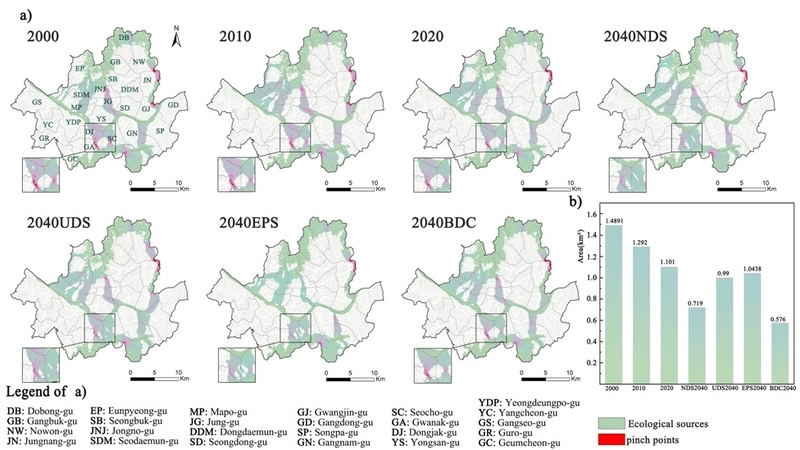
Fig. 4. a) indicates that ecological pinch points in Seoul exhibit a significant spatial clustering pattern. Across different periods, pinch points are mainly distributed in linear or point clusters along the main corridor of the Han River and at the intersections of its secondary corridors. They repeatedly appear at corridor junctions along the eastern boundary of the city and are consistently concentrated around the boundaries of Nowon-gu (NW), Jungnang-gu (JN), Dongjak-gu (DJ), Gwanak-gu (GA), and Seocho-gu (SC).
Ecological pinch points a) Spatial distribution b) Area statistics
These locations generally correspond to narrow passages or junction bottlenecks connecting major ecological sources, indicating that ecological flows rely heavily on a limited number of critical transitional segments. Fig. 4. b) further shows that the total area of pinch points, calculated as the sum of raster cell areas identified as pinch points, exhibited a clear and continuous decline from 2000 to 2020. Specifically, the area decreased from 1.4891km2 in 2000 to 1.292km2 in 2010, and further to 1.101km2 in 2020. This sustained reduction suggests that rapid urbanization and intensified human activities over the past two decades have placed increasing pressure on ecological corridors, resulting in the contraction and fragmentation of critical transitional areas between ecological sources. Under all simulated scenarios for 2040, the total pinch point area remained lower than that observed in 2020, although clear differences emerged among scenarios. The pinch point area ranked from highest to lowest as follows: EPS (1.0438km2)>UDS (0.99km2)>NDS (0.719km2)>BDC (0.576km2). Among these, the BDC scenario showed the most pronounced decline, with the pinch point area reduced to only 0.576km2. This result suggests that balanced development may substantially alter previously vulnerable corridor junctions through spatial restructuring. By contrast, the EPS scenario retained a relatively larger pinch point area, indicating that although ecological protection improves overall network structure, some critical transitional areas remain under persistent connectivity pressure.
4.4. Ecological Barrier Points
Ecological barrier points represent areas with the greatest potential for improving the quality of the ecological network through restoration. As shown by the spatial distribution changes (Fig. 5. a)), the layout of ecological barrier points in Seoul has remained relatively stable across different periods and largely overlaps with the distribution of pinch points. These barrier points are mainly concentrated around central urban districts, including Seodaemun-gu (SDM), Jongno-gu (JNJ), and Jung-gu (JG). This pattern can be attributed to two main factors. First, as historical urban cores of Seoul, these areas contain dense building clusters and transportation infrastructure that have severed the spatial connectivity of the original green spaces, thereby disrupting the ecological environment. Second, these locations lie at the intersections of multiple potential ecological corridors, where the conflict between intensive urban development and the need for ecological expansion results in a high concentration of barrier points. Further analysis of historical changes (Fig. 5. b)) shows that the total extent of ecological barrier points decreased from 3.2612km2 in 2000 to 2.9488km2 in 2010 (-9.58%), and then increased to 4.0109km2 in 2020 (+36.02%). This trend indicates that urban spatial compression over the past two decades has led to a renewed increase in highly resistant segments within key ecological corridors. Looking ahead to 2040, significant differences emerge among the development scenarios. Under the NDS scenario, the extent increases to 4.5073km2 (+12.38% compared with 2020), while under the UDS scenario it further rises to 5.8433km2 (+45.69%), indicating that expansion-oriented development will substantially intensify corridor barriers and fragmentation risks. In contrast, under the EPS scenario the extent declines to 2.2215km2 (-44.61%), while under the BDC scenario it remains relatively stable at 4.0131km2 (+0.05%), suggesting that ecological priority or balanced development strategies can effectively mitigate or stabilize major barrier segments.
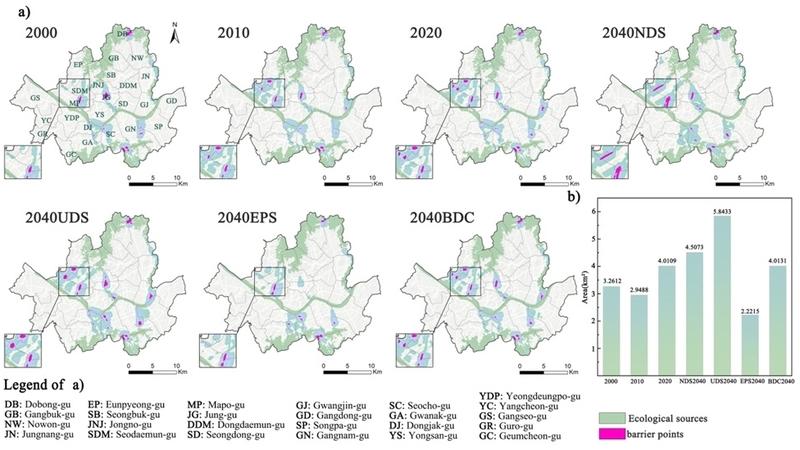
Ecological barrier points a) Spatial distribution. b) Area statistics
Overall, the spatiotemporal evolution of ecological barrier points reveals the key conflict locations within the ecological network that require refined management and restoration. These findings provide a direct basis for subsequent corridor optimization and the identification of priority areas for ecological restoration. To facilitate a clearer comparison across historical periods and future scenarios, the key numerical results are summarized in Table 3.
Summary of GI network characteristics across historical periods and future scenarios
4.5. GI Network Structure
Based on a static comparison of node centrality indicators within Seoul’s ecological network (Fig. 6.), the historical evolution exhibits a transition from a multi-core structure toward the aggregation of key nodes. In the 2000 network, the node with the highest degree centrality was Node 7, with a degree of 5, while the nodes with the highest betweenness centrality and closeness centrality were both Node 5, with a betweenness centrality of 0.348 and a closeness centrality of 0.611. This indicates that, in the early stage, the network’s connectivity hubs and pathway control points did not fully overlap, and key functions were relatively dispersed across multiple nodes. By 2010, the node with the highest degree centrality shifted to Node 3, with a degree of 5, while the highest betweenness and closeness centrality values were observed at Node 7, where betweenness centrality increased to 0.409 and closeness centrality reached 0.619. This suggests that cross-cluster connectivity within the network became increasingly dependent on a small number of bridging nodes. In 2020, a more pronounced centralization pattern emerged. Node 3 simultaneously exhibited the highest values for degree centrality, betweenness centrality, and closeness centrality, with the degree increasing to 6, betweenness centrality reaching 0.377, and closeness centrality reaching 0.591. This indicates that, during this stage, the organization of network connectivity, the control of shortest paths, and overall accessibility became increasingly dominated by a single key node, highlighting the rising importance of individual critical nodes within the network.
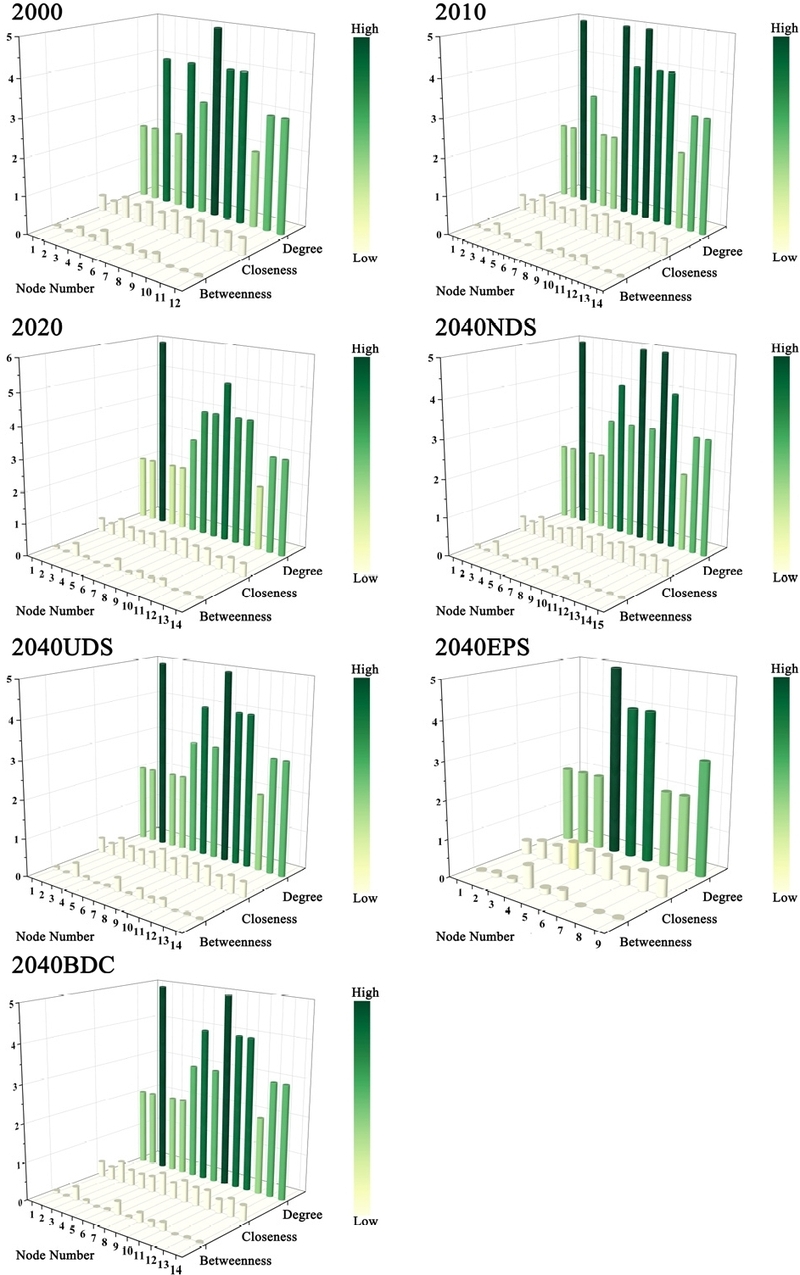
Static network structure
Under the future scenarios for 2040, distinct differences in key node structures emerge across development pathways. In the NDS2040 scenario, the node with the highest degree centrality and betweenness centrality is Node 3, with a degree of 5 and a betweenness centrality of 0.344, while the node with the highest closeness centrality is Node 7, with a closeness centrality of 0.560. This configuration reflects a separation between connectivity hubs and accessibility centers, indicating that key roles are relatively distributed across multiple nodes. In the UDS2040 and BDC2040 scenarios, the centrality distributions are highly consistent. In both scenarios, Node 3 has the highest degree centrality and betweenness centrality, with a degree of 5 and a betweenness centrality of 0.344, while Node 7 has the highest closeness centrality at 0.591. This pattern indicates that the roles of core nodes remain stable and that functional divisions within the network are clearly defined under these two scenarios. By contrast, the EPS2040 scenario exhibits the strongest single-core control structure. Node 4 simultaneously possesses the highest degree centrality, betweenness centrality, and closeness centrality, with a degree of 5, a significantly elevated betweenness centrality of 0.583, and a closeness centrality of 0.727. This indicates that the network’s shortest paths and overall accessibility become more concentrated around a single node, implying that damage to this node would more easily trigger structural fragmentation risks. Overall, the static topology of Seoul’s ecological network demonstrates a temporal trend toward the concentration of key nodes. Among the future scenarios, EPS exhibits the highest level of centrality concentration, while UDS and BDC display relatively more balanced structures, with NDS positioned between these two conditions.
Based on the robustness simulation of Seoul’s temporal ecological network, Global Efficiency Retention and Valid Node Pair Ratio respectively characterize the network’s capacity to maintain efficiency and preserve reachable relationships during the progressive failure of nodes. Under random attacks, both indicators exhibit clear stage-specific differences. Global Efficiency Retention remains relatively high in 2000 and 2020, requiring the removal of approximately 78.8% and 75.3% of nodes, respectively, before declining to 50%, whereas the network in 2010 is the most sensitive, reaching the 50% threshold after the removal of only about 54.9% of nodes. This indicates that, under non-targeted disturbances, the network during this period was more prone to a rapid increase in overall accessibility costs. Among the 2040 scenarios, BDC shows the strongest efficiency resilience, with its 50% threshold significantly delayed to approximately 87.7%, exceeding those of NDS (about 70.3%), UDS (about 68.8%), and EPS (about 61.0%). By contrast, Valid Node Pair Ratio declines earlier under random attacks, suggesting that the network typically first experiences a reduction in reachable node pairs and local fragmentation, which is only later followed by a marked decline in global efficiency. The capacity to maintain reachable node pairs is strongest in 2000, with a 50% threshold of about 62.2%, followed by 2020 at about 54.6%. Both 2010 and BDC remain near 47%, whereas UDS records the lowest value at approximately 39.3%, indicating that it is more susceptible to a rapid loss of reachable relationships under random failures.
Under intentional attacks, the differences between the two indicators become further amplified, and different attack strategies reveal distinct forms of critical dependence. Overall, Valid Node Pair Ratio is more sensitive to targeted removal and often drops sharply at an early stage, reflecting the rapid fragmentation of the network into multiple isolated clusters. Global Efficiency Retention then declines, indicating increasing path detours and the collapse of accessibility efficiency. EPS exhibits the highest vulnerability under all three types of intentional attacks, as Valid Node Pair Ratio falls to 50% after the removal of only about 7.3% of nodes. At the same time, Global Efficiency Retention drops below 50% after the removal of only about 16.3% of nodes under degree-priority and closeness-centrality-priority attacks, and after only about 27.8% under betweenness-priority attacks. This suggests that the EPS network is highly dependent on a limited number of hub and bridging nodes, thereby exhibiting a pattern of high efficiency but low robustness. In contrast, UDS and BDC demonstrate more balanced robustness, with the 50% threshold of Valid Node Pair Ratio generally remaining stable at about 30.3%, while that of Global Efficiency Retention is also concentrated around 31.0%. Under betweenness- and closeness-centrality-based attacks, NDS shows relatively delayed efficiency thresholds, at approximately 36.1%; however, under degree-priority attacks, its Valid Node Pair Ratio declines to 50% much earlier, with a threshold of about 17.4%, indicating that its connectivity structure is more strongly controlled by highly connected hubs. Overall, Seoul’s ecological network exhibits a stage-specific trough in 2010 and a recovery in 2020 under random disturbances, whereas under targeted attacks, the differences in critical dependence among the 2040 scenarios become more evident. Among them, BDC and UDS display stronger capacities to maintain both efficiency and reachable relationships, whereas EPS requires greater redundancy of critical nodes and alternative inter-cluster pathways to reduce the risk of systemic disconnection.
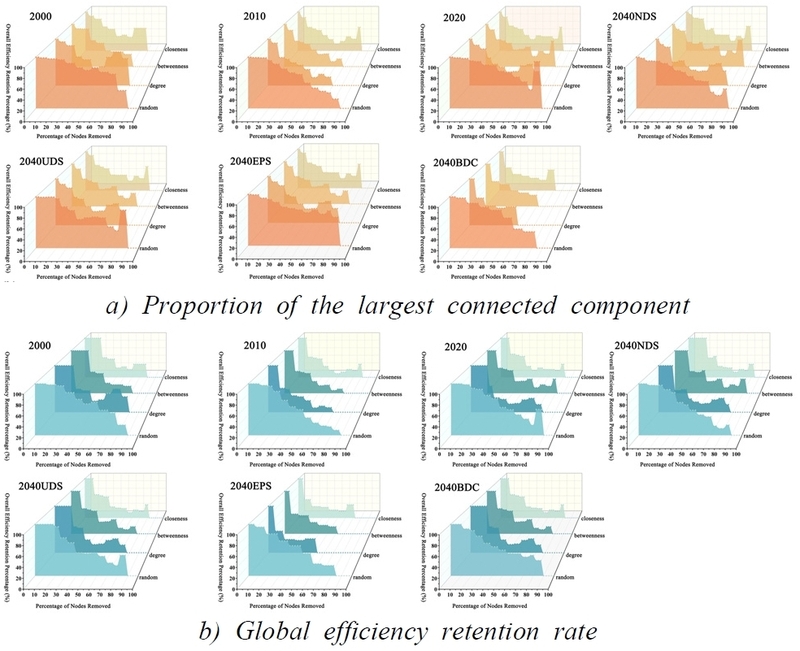
Dynamic network structure
5. Discussion
Between 2000 and 2020, under the pressure of high-density urban development, Seoul gradually established a comprehensive governance pathway characterized by “refined development control—ecological information support—public space and waterfront renewal.” Overall, this policy combination did not fundamentally alter the structural compression of ecological space caused by urbanization, but it significantly reshaped the maintenance mechanism of the GI network. Specifically, the connectivity of the GI network increasingly relies on the compensatory extension of corridor systems rather than on the systematic restoration of low-resistance ecological substrates. Land-use transition results indicate that the proportion of built-up land increased from approximately 57% to about 60%, while forest land and cropland declined from approximately 23% to about 21% and from approximately 15% to about 13%, respectively. The continuous contraction of ecological land laid the foundation for subsequent increases in landscape resistance and the rising costs of ecological connectivity. At the policy level, around 2000 Seoul strengthened development control at the district scale, such as through district unit plans, and enhanced the identifiability and enforceability of ecological regulation by introducing the biotope map as an ecological baseline. However, the results of this study indicate that these tools mainly improved the capacity for localized optimization and were insufficient to suppress the cumulative effects of fragmentation at the city scale. Between 2000 and 2010, the total length of ecological sources decreased from 98.024km to 96.607km, while the number increased from 12 to 14, indicating that large ecological sources were fragmented into smaller patches. From 2010 to 2020, the total length of ecological sources further declined to 92.147km, and no new effective patches were formed, suggesting that peripheral ecological spaces continued to be gradually encroached upon. Meanwhile, the resistance pattern exhibited a spatial lock-in characterized by persistently high resistance in core urban areas. Extremely high resistance zones expanded within central districts, exerting sustained pressure on ecological flow pathways.
In terms of blue–green space renewal, the Cheonggyecheon restoration project reflected a governance shift from transportation priority to environmental and public-space priority. However, its effects were mainly limited to local node and corridor improvement and were insufficient to offset the expansion of high-resistance areas caused by the broader tendency of land use toward built-up development. As a result, localized ecological improvements coexisted with overall ecological compression, and the GI network increasingly relied on compensatory corridor adjustments to maintain connectivity. Specifically, 18 corridors with a total length of 53.787km were identified in 2000; this increased to 22 corridors and 64.054km in 2010; and by 2020, the number of corridors remained at 21 while total length further reached 63.768km. This suggests that under limited availability of new corridor space, the network mainly maintained accessibility through path detours and extensions, increasing migration distance and potential ecological costs. At the same time, the area of critical transitional segments (pinch points) continuously declined from 2000 to 2020, indicating persistent compression of narrow passages, growing dependence of ecological flows on a limited number of key segments, and an increasing concentration of connectivity risk. In the mid-to-late 2010s, the Seoul 2030 Comprehensive Plan provided institutional support for integrating GI into living-environment improvement and spatial structure optimization, but historical indicators suggest that this shift had not yet produced structural effects strong enough to reverse existing trends before 2020. Overall, from 2000 to 2020, Seoul’s GI network exhibited a high-cost maintenance connectivity pattern under high-resistance lock-in: although policies improved ecological identification and localized renewal capacity, network-level connectivity was still maintained mainly through compensatory mechanisms of corridor densification and path extension.
Building on the historical baseline, the future scenario simulations indicate that different policy orientations shift the feedback mechanism of the GI network from a single compensatory adjustment pathway to a coupled response involving resistance regulation, source reorganization, and key-node dependency. Under the NDS, UDS, and BDC scenarios, where development inertia and development demand remain strong, the number of ecological corridors and their total length both stay relatively high. This suggests that when ecological spaces remain fragmented and resistance cannot be substantially reduced, the network must still depend on more connections and longer pathways to maintain accessibility. This pattern is consistent with the historical trend in which corridor numbers stabilized while corridor length continued to increase. By contrast, the EPS scenario significantly alters this feedback pathway. The number of ecological sources decreases to nine, but their scale expands, while both corridor number and total length decline. This indicates that connectivity maintenance shifts from path-based compensation to a positive feedback mechanism driven by resistance restoration and source integration. However, this transition is accompanied by increased centrality concentration and stronger dependence on key nodes. Robustness tests show that under targeted attacks, both reachable node pairs and global efficiency decline earlier, suggesting that gains in efficiency may come at the cost of greater sensitivity to critical hubs. These findings imply that moving beyond a high-cost maintenance connectivity pattern requires not only reducing resistance and integrating ecological sources, but also dispersing critical dependencies through redundant links and alternative pathways. Otherwise, the network may shift from a high-cost maintenance structure to one that is more efficient but also more vulnerable.
6. Conclusions
This study shows that the evolution of Seoul’s green infrastructure network has been jointly shaped by land-use change, ecological source fragmentation, and increasing landscape resistance under high-density urban development. From 2000 to 2020, built-up land expansion continuously compressed ecological space and increased the cost of maintaining connectivity. As a result, the GI network increasingly relied on compensatory corridor extension, while critical bottlenecks and pinch points became more concentrated. Scenario analysis further reveals clear differences in GI network responses under different development pathways. The NDS, UDS, and BDC scenarios largely continue the historical pattern of compensatory connectivity, whereas the EPS scenario improves network structure through source consolidation and resistance restoration. However, structural optimization does not necessarily enhance robustness. In particular, the EPS scenario shows stronger dependence on key nodes and transitional areas, indicating greater vulnerability to targeted disturbances. These findings have important implications for ecological planning and land-use governance in high-density cities such as Seoul. Future GI planning should move beyond simply increasing corridor numbers or extending corridor length, and instead place greater emphasis on reducing ecological resistance, protecting key pinch points and bottlenecks, and preserving the integrity of major ecological sources. At the policy level, the coordination of land-use regulation, ecological restoration, and spatial development control is essential for avoiding the long-term concentration of connectivity risks. More specifically, integrating ecological network thinking into urban renewal, growth management, and open-space planning may help cities balance development needs with ecological sustainability more effectively. This study also has several limitations. The resistance surface was based on generalized factors and may not fully reflect species-specific movement or micro-scale habitat heterogeneity. In addition, the scenario settings involve uncertainty, and the results were not directly validated with empirical ecological or biodiversity data. Future research should incorporate finer-resolution variables, species-specific parameters, and long-term monitoring to improve the reliability and applicability of GI network assessment.
References
-
J.S. Deng et al., Spatio-temporal dynamics and evolution of land use change and landscape pattern in response to rapid urbanization, Landscape and Urban Planning, 92, 2009, pp.187-198.
[https://doi.org/10.1016/j.landurbplan.2009.05.001]

-
P. Tian et al., Spatiotemporal patterns of urban expansion and trade-offs and synergies among ecosystem services in urban agglomerations of China, Ecological Indicators, 148, 2023, 110057.
[https://doi.org/10.1016/j.ecolind.2023.110057]
-
J. Fischer, D.B. Lindenmayer, Landscape modification and habitat fragmentation: A synthesis, Global Ecology and Biogeography, 16, 2007, pp.265-280.
[https://doi.org/10.1111/j.1466-8238.2007.00287.x]
-
R.K. Runting et al., Incorporating climate change into ecosystem service assessments and decisions: A review, Global Change Biology, 23, 2017, pp.28-41.
[https://doi.org/10.1111/gcb.13457]
-
H. Long et al., Effects of land use transitions due to rapid urbanization on ecosystem services: Implications for urban planning in the new developing area of China, Habitat International, 44, 2014, pp.536-544.
[https://doi.org/10.1016/j.habitatint.2014.10.011]
-
X. Fang, J. Li, Q. Ma, Integrating green infrastructure, ecosystem services and nature-based solutions for urban sustainability: A comprehensive literature review, Sustainable Cities and Society, 98, 2023, 104843.
[https://doi.org/10.1016/j.scs.2023.104843]
-
C. Liquete et al., Mapping green infrastructure based on ecosystem services and ecological networks: A Pan-European case study, Environmental Science and Policy, 54, 2015, pp.268-280.
[https://doi.org/10.1016/j.envsci.2015.07.009]
-
A. Tong et al., Constructing an ecological spatial network optimization framework from the pattern–process–function perspective: A case study in Wuhan, Remote Sensing, 17, 2025, 2548.
[https://doi.org/10.3390/rs17152548]
-
S. Zhang et al., Construction of landscape ecological network based on MCR risk assessment model: A case study of Liaoning Province, China, Ecological Indicators, 166, 2024, 112549.
[https://doi.org/10.1016/j.ecolind.2024.112549]
-
E. Lindeijer, Review of land use impact methodologies, Journal of Cleaner Production, 8, 2000, pp.273-281.
[https://doi.org/10.1016/S0959-6526(00)00024-X]
-
J. Lin et al., An assessment framework for improving protected areas based on morphological spatial pattern analysis and graph-based indicators, Ecological Indicators, 130, 2021, 108138.
[https://doi.org/10.1016/j.ecolind.2021.108138]
-
C. Yang et al., Ecological network construction of a national park based on MSPA and MCR models: An example of the proposed national parks of “Ailaoshan-Wuliangshan” in China, Land, 11, 2022, 1913.
[https://doi.org/10.3390/land11111913]
-
S. Guo et al., Identifying ecological priority protection and restoration areas based on the changing characteristics of ‘past-future’ ecological security patterns: A case study of Nanning, Ecological Indicators, 182, 2026, 114617.
[https://doi.org/10.1016/j.ecolind.2026.114617]
-
Y. Ye et al., Construction of an ecological resistance surface model and its application in urban expansion simulations, Journal of Geographical Sciences, 25, 2015, pp.211-224.
[https://doi.org/10.1007/s11442-015-1163-1]
-
H. Wei et al., Construction and optimization of ecological security pattern in the Loess Plateau of China based on the minimum cumulative resistance (MCR) model, Remote Sensing, 14, 2022, 5906.
[https://doi.org/10.3390/rs14225906]
-
B.H. McRae, P. Beier, Circuit theory predicts gene flow in plant and animal populations, Proceedings of the National Academy of Sciences, 104, 2007, pp.19885-19890.
[https://doi.org/10.1073/pnas.0706568104]
-
B.H. McRae et al., Using circuit theory to model connectivity in ecology, evolution, and conservation, Ecology, 89, 2008, pp.2712-2724.
[https://doi.org/10.1890/07-1861.1]
-
W. Van Oijstaeijen et al., Urban green infrastructure: A review on valuation toolkits from an urban planning perspective, Journal of Environmental Management, 267, 2020, 110603.
[https://doi.org/10.1016/j.jenvman.2020.110603]
-
Y. Liu et al., Modelling urban change with cellular automata: Contemporary issues and future research directions, Progress in Human Geography, 45, 2021, pp.3-24.
[https://doi.org/10.1177/0309132519895305]
-
P. Opdam et al., Ecological networks: A spatial concept for multi-actor planning of sustainable landscapes, Landscape and Urban Planning, 75, 2006, pp.322-332.
[https://doi.org/10.1016/j.landurbplan.2005.02.015]
-
G. MacLeod, M. Goodwin, Space, scale and state strategy: Rethinking urban and regional governance, Progress in Human Geography, 23, 1999, pp.503-527.
[https://doi.org/10.1191/030913299669861026]
-
A. Gonzalez et al., Spatial ecological networks: Planning for sustainability in the long-term, Current Opinion in Environmental Sustainability, 29, 2017, pp.187-197.
[https://doi.org/10.1016/j.cosust.2018.03.012]
-
L. Zou et al., Land use conflict identification and sustainable development scenario simulation on China's southeast coast, Journal of Cleaner Production, 238, 2019, 117899.
[https://doi.org/10.1016/j.jclepro.2019.117899]
-
Y. Wu et al., The impact of urbanization policy on land use change: A scenario analysis, Cities, 28, 2011, pp.147-159.
[https://doi.org/10.1016/j.cities.2010.11.002]
-
N.R. Magliocca et al., Review of counterfactual land change modeling for causal inference in land system science, Journal of Land Use Science, 18, 2023, pp.1-24.
[https://doi.org/10.1080/1747423X.2023.2173325]
-
Y. Ma et al., Spatio-temporal evolution characteristics analysis and optimization prediction of urban green infrastructure: A case study of Beijing, China, Scientific Reports, 12, 2022, 10702.
[https://doi.org/10.1038/s41598-022-14613-z]
-
A. Colsaet et al., What drives land take and urban land expansion? A systematic review, Land Use Policy, 79, 2018, pp.339-349.
[https://doi.org/10.1016/j.landusepol.2018.08.017]
- Y.-S. Lee, H. Shin, Negotiating the polycentric city-region: Developmental state politics of new town development in the Seoul capital region, Urban Studies, 49, 2012, pp.1333-1355.
-
H. Hao et al., Empowering scenario planning with artificial intelligence: A perspective on building smart and resilient cities, Engineering, 43, 2024, pp.272-283.
[https://doi.org/10.1016/j.eng.2024.06.012]
-
R. Hakhamanesh et al., Integrating static and dynamic game theory with complex networks: Enhancing strategy dynamics through adaptive update rules, Chaos, Solitons and Fractals, 192, 2025, 116063.
[https://doi.org/10.1016/j.chaos.2025.116063]
-
D. Lee, H. Choe, Estimating the impacts of urban expansion on landscape ecology: Forestland perspective in the greater Seoul metropolitan area, Journal of Urban Planning and Development, 137, 2011, pp.425-437.
[https://doi.org/10.1061/(ASCE)UP.1943-5444.0000090]
-
J.H. Jo et al., Incorporating built environment factors into climate change mitigation strategies for Seoul, South Korea: A sustainable urban systems framework, Habitat International, 33, 2009, pp.267-275.
[https://doi.org/10.1016/j.habitatint.2008.10.020]
-
M. Li et al., Identifying the optimization potential for urban GI by linking supply and demand of ecosystem services under multi-scenarios: A case study of Tianjin, China, Ecological Indicators, 154, 2023, 110570.
[https://doi.org/10.1016/j.ecolind.2023.110570]
- A.S. Negi, P.K. Mann, Compact urban development and sustainable development: A legal study, Panjab University Law Review, 63, 2024.
-
D. Wang et al., Urban green infrastructure: Bridging biodiversity conservation and sustainable urban development through adaptive management approach, Frontiers in Ecology and Evolution, 12, 2024, 1440477.
[https://doi.org/10.3389/fevo.2024.1440477]
-
M. Herold et al., The role of spatial metrics in the analysis and modeling of urban land use change, Computers, Environment and Urban Systems, 29, 2005, pp.369-399.
[https://doi.org/10.1016/j.compenvurbsys.2003.12.001]
-
S. Song et al., Multiple scenario simulation and optimization of an urban green infrastructure network based on complex network theory: A case study in Harbin City, China, Ecological Processes, 11, 2022, 33.
[https://doi.org/10.1186/s13717-022-00372-2]
-
A. Comber et al., What is land cover?, Environment and Planning B: Planning and Design, 32, 2005, pp.199-209.
[https://doi.org/10.1068/b31135]
- Q. Jing et al., Analysis of the spatiotemporal changes in global land cover from 2001 to 2020, Science of the Total Environment, 908, 2024, 168354.
-
B. Fu et al., Ecosystem services in changing land use, Journal of Soils and Sediments, 15, 2015, pp.833-843.
[https://doi.org/10.1007/s11368-015-1082-x]
-
X. Liang et al., Understanding the drivers of sustainable land expansion using a patch-generating land use simulation (PLUS) model: A case study in Wuhan, China, Computers, Environment and Urban Systems, 85, 2021, 101569.
[https://doi.org/10.1016/j.compenvurbsys.2020.101569]
-
S. Chen, S. Yao, Identifying the drivers of land expansion and evaluating multi-scenario simulation of land use: A case study of Mashan County, China, Ecological Informatics, 77, 2023, 102201.
[https://doi.org/10.1016/j.ecoinf.2023.102201]
-
H. Wu et al., Identifying core driving factors of urban land use change from global land cover products and POI data using the random forest method, International Journal of Applied Earth Observation and Geoinformation, 103, 2021, 102475.
[https://doi.org/10.1016/j.jag.2021.102475]
-
G. Zhou, H. Long, Explanation of land-use system evolution: Modes, trends, and mechanisms, Land Use Policy, 150, 2025, 107470.
[https://doi.org/10.1016/j.landusepol.2025.107470]
-
B. Li et al., Land use evolution and multi-scenario simulation of shrinking border counties based on the PLUS model: A case study of Changbai County, Sustainability, 17, 2025, 6441.
[https://doi.org/10.3390/su17146441]
-
P. Wang et al., Dynamic characteristics and responses of ecosystem services under land use/land cover change scenarios in the Huangshui River Basin, China, Ecological Indicators, 144, 2022, 109539.
[https://doi.org/10.1016/j.ecolind.2022.109539]
- G. Li et al., Multiple scenario land use simulation based on a coupled MOGA-PLUS model: A case of the Yellow River Basin, Environmental Science and Pollution Research, 31, 2024, pp.42902-42920.
-
J. Liu et al., Prediction of land use for the next 30 years using the PLUS model's multi-scenario simulation in Guizhou Province, China, Scientific Reports, 14, 2024, 13143.
[https://doi.org/10.1038/s41598-024-64014-7]
-
H. Kikuchi et al., Dynamic simulations of compact city development to counter future population decline, Cities, 127, 2022, 103753.
[https://doi.org/10.1016/j.cities.2022.103753]
-
Y. Jia et al., Landscape pattern indices for evaluating urban spatial morphology-A case study of Chinese cities, Ecological Indicators, 99, 2019, pp.27-37.
[https://doi.org/10.1016/j.ecolind.2018.12.007]
-
J. Luo, H. Fu, Construct the future wetland ecological security pattern with multi-scenario simulation, Ecological Indicators, 153, 2023, 110473.
[https://doi.org/10.1016/j.ecolind.2023.110473]
-
T. Zhai, L. Huang, Linking MSPA and circuit theory to identify the spatial range of ecological networks and its priority areas for conservation and restoration in urban agglomeration, Frontiers in Ecology and Evolution, 10, 2022, 828979.
[https://doi.org/10.3389/fevo.2022.828979]