A Multidimensional Analysis of the Relationship Between Urban Physical Environment and Mental Health
ⓒ 2025. KIEAE all rights reserved.
Abstract
This study aims to examine how urban physical environmental factors affect residents’ mental health, focusing on four key indicators: suicide risk, depression, anxiety disorder, and perceived stress. While previous studies often targeted a single outcome or specific region, this research adopts a multidimensional approach to identify how different environmental characteristics distinctly influence each mental health indicator.
Data were drawn from the 2022 Korea National Health and Nutrition Examination Survey (KNHANES), including responses from 6,265 adults nationwide. A multilevel logistic regression analysis was conducted to examine the relationship between mental health and urban environmental factors, distinguishing between personal-level (Level 1) and regional-level (Level 2) characteristics. Each mental health outcome variable was binarized and analyzed separately. Regional-level variables were categorized into three domains: (1) spatial environment (air pollution level, building density, walkability), (2) land use (land-use mix, green area ratio, residential area ratio, commercial area ratio), and (3) urban planning facility (schools, cultural facilities, sports facilities, welfare facilities, medical institutions). personal-level characteristics were included as control variables.
The results showed that urban physical environmental factors had differential effects on mental health indicators. Suicide risk was associated with pollution level, number of schools, and number of medical facilities. Depression was associated with building density, land-use mix, housing ratio, and commercial ratio. Anxiety disorder was not significantly associated with any environmental variables. Perceived stress was associated with walkability.
Keywords:
Urban Environment, Mental Health, Korea National Health and Nutrition Examination Survey1. Introduction
1.1. Background and Purpose
Mental health issues have become a prominent social issue in South Korea. The Ministry of Health and Welfare has reported a persistent upward trend in the number of individuals experiencing mental illnesses such as depression, anxiety disorders, and suicide risk. Mental illness, once a purely individual concern, has become a social issue that poses a threat to the quality of life enjoyed, given its increasing prevalence [1]. This underscores the pressing need for a comprehensive, multifaceted analysis of the underlying causes and the development of targeted responses.
Mental health issues in South Korea are closely tied to the country’s rapid urbanization. Following the implementation of the economic development plan in the 1960s, the nation witnessed a period of unprecedented economic growth. This period was accompanied by a proliferation of urban problems, including rapid urban expansion, population concentration in major cities, indiscriminate development, and imbalances in urban infrastructure. In particular, after more than 80% of the country became urbanized in the early 1990s, the suicide rate has shown a marked increase, reaching levels more than 330% higher than those recorded at that time. According to 2022 statistics, the suicide rate in South Korea stands at 25.2 per 100,000 people, which is the highest level compared to the OECD average suicide rate of 10.6 per 100,000 [2]. These statistics suggest that the problems stemming from urbanization are not merely physical issues but can also significantly impact the mental health and quality of life of individuals residing in urban areas.
Discussions on mental health have been addressed primarily as individual-level issues within the fields of public health and social welfare. Even after the argument that factors affecting mental health extend beyond the individual level and are related to the environmental context surrounding the individual gained acceptance, the primary focus of research remained skewed toward socioeconomic environments [3,4]. The investigation into the relationship between living spaces and mental and physical health began overseas around the conclusion of World War II. Initially, the scope of research focused on the quality of housing and sanitary conditions. Nevertheless, it subsequently expanded to encompass neighborhood and urban environments [5,6]. In South Korea, research on mental health and the built environment began with studies on residential stress in apartment settings during the 1990s [5]. Since the 2000s, the scope of research has expanded to examine the relationship between neighborhood environments and mental health [7~9]. Consequently, recent studies have indicated the potential for urban physical environmental factors and physical activity to influence mental health [4,6,10~11]. Additionally, interest in the relationship between urban physical environments and mental health has been steadily increasing in South Korea. However, extant studies have been largely confined to specific cities or limited regions, and their results have been interpreted as local effects within specific spatial scopes, which poses certain limitations. The survey method also relied on self-reporting measurement scales based on local residents’ subjective perceptions, which also limited its external validity and generalizability. Furthermore, in the establishment of mental health indicators as dependent variables, most studies have focused exclusively on a single indicator, such as depression. This methodological approach hinders the comprehensive capture of the multidimensional nature of mental health and the intricate effects of urban environmental factors on it.
Urban environments are characterized by the interaction of various physical elements. Simultaneously, mental health is a complex and multidimensional concept that cannot be sufficiently explained by a single indicator. Consequently, there is a growing need for research utilizing sample data with adequate spatial coverage and demographic representativeness, reflecting regional characteristics and providing more generalizable results.
This study empirically examines the relationship between the physical environment of cities and mental health within a broader context by combining a representative sample across South Korea with nationwide urban environmental data. It has to discern overarching trends that supersede the distinct characteristics of specific regions and evaluate the hypothesis that physical environmental factors in urban areas exert disparate influences on various mental health indicators. Moreover, the findings of this study possess academic significance as foundational data that can serve as a basis for comparative research considering regional characteristics—such as city size and population structure—as well as for time-series studies that capture long-term trends.
1.2. Methods and Scope
This study analyzed the influence of urban environmental factors on the mental health of local residents throughout South Korea. The analysis was based on data from the 9th Korea National Health and Nutrition Examination Survey (KNHANES), which was conducted by the Korea Disease Control and Prevention Agency (KDCA) in 2022. The survey used a probability sampling method to ensure national representativeness, selecting 192 sample survey areas and conducting the survey on 25 households per area. Data from 4,800 households and 6,265 adult respondents were finally incorporated into the analysis. The survey used standardized measurement scales to assess mental health status, including suicide risk, depression, anxiety disorders, and perceived stress. This study set these factors as the dependent variables while using the demographic and individual health characteristics surveyed alongside them as control variables. Additionally, the physical environmental factors of cities were constructed using data such as the 2021 Urban Planning Status and Building Register Statistics provided by the Ministry of Land, Infrastructure and Transport, the 2021 Air Pollution Status data provided by the Ministry of Environment, and the 2021 Q4 National Hospitals and Clinics Status data provided by the Health Insurance Review and Assessment Service (HIRA). For the analysis, of the 229 city, county, and district datasets, only data from 130 cities, counties, and districts, containing 192 survey districts where respondents actually resided, were extracted and used to minimize spatial unit inconsistencies between the two datasets. This approach ensured a one-to-one correspondence between survey respondents and regional independent variables, eliminating potential interpretive errors caused by unit inconsistencies during the analysis process.
Based on a comprehensive review of previous domestic and international studies on the relationship between mental health and urban environments, the physical environmental factors of cities that influence mental health were categorized into three categories. First, the spatial environment characteristics formed a set of variables that reflected the city’s three-dimensional structure and density, including air pollution level, building density, and walkability. Second, the land-use characteristics comprised a set of variables that reflected the zoning structure of urban management plans, including the land-use mix and green, residential, and commercial area ratios to the total urban area. Third, the planned facility characteristics served as a set of variables to measure facility groups related to actual usage by local residents, including per capita school site area, per capita gross floor area of cultural, sports, welfare, and medical facilities, and the number of each facility per 1,000 city, county, and district residents. These variables were used as independent variables to analyze their relationship with mental health indicators empirically.
STATA 18 was used for a more precise analysis of the impact of urban environmental factors on residents’ mental health. This aimed to clarify the relationship between residents’ mental health and environmental characteristics at the urban unit level. The analysis systematically examines the correlation between each mental health indicator and physical environmental factors of the city.
2. Theoretical Perspectives
2.1. Concept of Urban Environment and Mental Health
Although discussions on health have traditionally centered on physical health, the 1948 World Health Organization (WHO) Constitution provided a more comprehensive definition of health. This charter defined health as “not merely the absence of disease or infirmity but a state of complete physical, mental, and social well-being [12].” This definition broadens the scope of health by expanding its focus beyond physical factors to include mental and social factors, marking a significant shift and redefining the landscape of modern public health. Furthermore, in 1974, Lalonde, who was Canada’s Minister of Health and Welfare at the time, introduced the Health Field Concept Model [13]. The Health Field Concept Model does not limit health to solely the outcome of medical factors. Rather, it categorizes health into four key factors: lifestyle, biological factors, the social and physical environment, and healthcare services. The model emphasizes the importance of nonmedical factors. Lalonde’s new perspective has been criticized for downplaying the impact of socioeconomic inequality on lifestyles and placing excessive responsibility on individuals’ lifestyle choices. However, it shifted the focus away from disease-centered treatment policies and became the foundation for designing health promotion and disease prevention policies.
Lalonde’s concept influenced the 1986 Ottawa Charter for Health Promotion, which was published by WHO. This charter posited that health was not merely an individual concern; rather, it was closely associated with social and environmental factors. To promote health, five key areas were proposed: the establishment of healthy public policies, creation of health-supportive environments, strengthening of community activities, development of individual capabilities, and reorientation of health services. This underscores the need for a policy approach that considers numerous factors surrounding individuals in a multidimensional manner rather than confining health to problem-solving for individuals or solely relying on medical interventions [14].
Subsequently, as economic development advanced and societal interest in quality of life increased, the concept of health expanded beyond physical health to encompass mental health as well. Societal interest in and demand for mental health services are growing. The WHO defines mental health as “a state of well-being in which every individual can realize their potential, cope with the normal stresses of life, work productively, and contribute to their community”[16]. The definition of mental health provided in the report encompasses the absence of mental illness and a more comprehensive understanding that incorporates functional resilience as a member of society and satisfaction with one’s personal quality of life. South Korea has also embraced this international paradigm by establishing the National Center for Mental Health and conducting mental health surveys1) every five years, continuing its efforts to develop policies required for promoting the mental health of its citizens.
The 2021 Mental Health Status Survey Report2) indicated a lifetime prevalence rate of mental disorders3) of 27.8%—more than a quarter of the population experienced a mental disorder at least once in their lifetime [17]. Furthermore, in the awareness survey of the 2024 National Mental Health Knowledge and Attitude Survey Report, 73.6% of respondents reported experiencing “mental health issues” in the past year, attributing these issues to life stress [1].
The National Center for Mental Health, an entity under the auspices of the Ministry of Health and Welfare, has delineated the concept of “mental health issues,” comprising several challenges that may be encountered by individuals, such as the following: depression, emotional volatility that results in substantial disruption to one’s daily life, uncontrollable expressions of anger, anxiety, insomnia, severe stress, suicidal ideation, memory impairment that leads to daily challenges, auditory hallucinations, visual hallucinations, delusional thinking, challenges with alcohol use, drug addiction, gambling addiction, other forms of addiction, unexplained physical discomfort, and uncontrollable obsessive thoughts and compulsive behaviors [1]. Mental health is a multifaceted concept, requiring the consideration of multiple indicators to provide a comprehensive description. Therefore, research in the field of mental health requires an overarching approach, considering multiple sub-indicators and examining their interactions with external environmental factors from diverse perspectives.
Mental health issues have already become a pervasive concern. Additionally, mental health is recognized not as an individual problem but as a challenge to be addressed by society as a whole. Considering the growing interest in the physical environment of cities as a pivotal factor in mental health, a compelling need arises to examine the relationship between urban environments and mental health.
The urban environment exerts a significant influence on the emotional stability and mental health of local residents, extending beyond its role in providing fundamental infrastructure for daily life. In 1961, a conference on architectural psychology and psychiatry was convened in Utah, USA, signifying the genesis of the direct relationship between environmental design and psychology and sociology. The establishment of the Environmental Design Research Association in the United States during the 1970s marked the inception of a significant interdisciplinary dialogue, fostering the development of a robust connection between environmental design and related fields such as psychology and anthropology [18].
Research on the relationship between human emotional responses and the environment stems from its roots in environmental psychology. Environmental psychology is dedicated to the study of the macro-level relationships between human cognition and behavior and artificial and natural environments [19]. The field of environmental psychology is subdivided into four distinct areas based on investigating specific research topics: the fundamental theory, variable-centered, place-centered, and evaluation and applied methodology research. Topics concerning artificial, natural, and ecological environments belong to the place-centered research field [18]. Research on artificial environments has developed within the field of ecological psychology, while that on natural environments has evolved, focusing on the restorative effects provided by nature.
Ecopsychology is a field pioneered primarily by Barker, focusing on research concerning the programmatic aspects of artificial physical environments. Barker (1968) proposed the behavior setting theory based on ecological psychology [20]. The behavioral setting theory focuses on the study of bounded environments, with the behavioral setting serving as the fundamental unit of analysis. These environments can vary in scope, ranging from modest spaces, such as playgrounds, to expansive settings that encompass entire cities. This theory posits that specific spaces should not be considered mere physical backdrops but structural units within which behaviors, rules, and collective activities are repeated. It elucidates that artificial environmental spaces, including classrooms, libraries, and cafeterias, function as contextual frameworks that induce specific behavioral patterns and regulate human actions [18]. In accordance with the principles of the behavioral setting theory, researchers in the field of ecological psychology adopt a comprehensive approach that encompasses physical enhancements, operational improvements, program enhancements, and other related aspects. Subsequently, Wicker (1979) advanced the behavioral setting theory to incorporate temporal boundaries within the behavioral domain [21].
The prevailing theoretical frameworks elucidating the restorative impact of nature predominantly encompass the stress reduction and attention restoration theories. Ulrich (1979) experimentally demonstrated the stress reduction theory, asserting that direct or indirect exposure to nature reduces stress and provides psychological stability [22,23]. Ulrich conducted an experiment in which he presented college students experiencing elevated stress levels due to midterm exams with natural landscapes. The results of the experiment demonstrated that exposure to natural landscapes led to a reduction in stress levels [22]. Furthermore, an experimental study was conducted to compare recovery rates among surgical patients residing in hospital rooms with a view of trees outside the window with those without such a view. The findings indicated that individuals with a view of trees exhibited enhanced recovery speed, reduced analgesic consumption, and decreased levels of tension and anxiety [23]. Kaplan and Kaplan (1989) proposed the attention restoration theory, suggesting that natural environments alleviated accumulated attention fatigue [24]. Students must use directed attention, which refers to the deliberate focus on objects that do not naturally attract their interest, when performing tasks. The accumulation of this state leads to mental exhaustion. Encountering nature, the object of effortless attention, restores emotional well-being and improves concentration, cognitive task performance, and memory [25].
This discussion on urban environments and mental health emphasized that mental health is closely associated with personal factors and the physical environment, expanding the existing understanding of the determinants of mental health. This shift in perception has led to an increase in attempts, domestically and internationally, to analyze the relationship between urban environments and mental health.
Evans (2003) systematically analyzed the relationship between urbanization and mental health from this perspective. The study argued that physical stressors such as urban density, noise, and air pollution significantly impact emotional fatigue and depression among local residents [6]. Lim (2021) conducted a comprehensive literature review on positive and negative factors affecting mental health to identify planning characteristics applicable to urban environments, concluding that factors such as urban air pollution, walkability, green area ratio, and building density directly and indirectly impacted mental health [5]. Nam et al. (2023) conducted a multilevel regression analysis at individual and neighborhood levels. Their findings revealed that residential stability, neighborhood accessibility, and neighborhood safety significantly influence depression levels among residents [26]. The study revealed that the mental health of residents is more likely to deteriorate in regions with a low green area ratio and high population density. Through an empirical study targeting older adults, Kim and Ahn (2011) demonstrated that physical environments closely tied to daily life could positively influence the alleviation of depressive feelings and promote emotional stability [11]. Previous studies on urban environments and mental health suggest that urban environments directly influence mental health rather than merely serving as a background factor.
2.2. Review of Previous Studies on Urban Environmental Factors and Mental Health Indicators
Prior to this study, a literature review was conducted, categorizing studies into mental health indicators and urban environmental factors. Previous studies have examined mental health indicators by setting suicide risk, depression, anxiety disorders, and perceived stress as dependent variables. Key urban environmental factors were also investigated based on commonly used variables. Accordingly, it intends to examine the grounds for selecting each variable based on existing literature.
First, suicide risk has been reported as an indicator of the severity of mental health issues, arising alongside factors such as high urban spatial density, a lack of green spaces, and feelings of social isolation. The global report by the WHO (2014) also indicated that countries with higher rates of urbanization have higher rates of youth suicide, emphasizing the need for an approach to urban planning that addresses this issue [27].
Depression is the most commonly used indicator as a representative variable of mental health across various countries. Research analyzing the relationship with depression is also actively underway in the field of urban studies. Galea et al. (2005) analyzed data collected via telephone surveys of respondents’ depression history and the environmental characteristics of their residential areas [28]. They concluded that social density and the quality of the living environment within cities are significantly correlated with residents’ feelings of depression. Maas et al. (2009) used large-scale panel data registered at general medical institutions across the Netherlands to analyze the correlation between the green area ratio within a 1 km and 3 km radius of residents and incidence of depression, revealing that regions with higher green area ratios had lower rates of depression among residents [29].
Analyses indicate that anxiety disorders are associated with various stressors characteristic of urban environments, including high-density urban habitats and noise. Halonen et al. (2014) demonstrated a quantitative correlation between road traffic noise and anxiety disorders in Finland [30]. This study revealed a positive correlation between elevated levels of nighttime noise and concomitant increases in anxiety levels and sleep disturbances.
Stress perception serves as an indicator reflecting the mental pressure and discomfort experienced in daily life. Additionally, previous studies have confirmed its relationship with various urban environmental factors. Green space, the pedestrian environment, and accessibility to neighborhood convenience facilities were evaluated as factors that positively influence stress recovery and cognitive relief. Roe et al. (2013) conducted a study targeting the Portland, Oregon area, and found a statistically significant negative correlation between the frequency of green space use and subjective stress levels [31].
The following three characteristics have been used in previous research to understand the relationship between urban environments and mental health.
First, spatial environment characteristics such as air pollution level, building density, and walkability are considered. Regarding the air pollution level, the findings indicate that exposure to high concentrations of fine particulate matter, ozone, and nitrogen dioxide has an adverse effect on mental fatigue, depression, and anxiety [32]. Long-term follow-up studies have demonstrated a causal relationship between exposure to air pollution and cognitive decline, as well as an increase in depressive symptoms [33]. Building density is a key variable for assessing the degree of urbanization in a city. In a study examining the correlation between congestion indices resulting from urban high-density living and psychological distress, Evans (2003) found that initial residential density was not associated with psychological distress. Nevertheless, after six months, a relationship emerged between residential density and negative effects [6]. Walkability is evaluated as a factor that promotes daily activities and enhances mental vitality. Additionally, walkable environments have been analyzed to influence stress relief and social interaction positively. Specifically, Lee and Ahn (2008) predicted that regularly repeated walking activities would improve health. Their empirical analysis of Seoul revealed that walking time was a significant factor in personal health [34].
Second, land-use characteristics include the land-use mix and green, residential, and commercial area ratios to the urban area. Lee and Lee (2016) conducted an empirical analysis on exercise intensity and health levels in Seoul, treating land-use mix as a variable that could influence physical activity and health. Entropy indices for residential, commercial, and office areas were used to measure land-use mix. Multilevel regression analyses conducted at individual and neighborhood levels revealed that, although land-use mix was not a significant factor for all health levels, it influenced obesity rates [8]. Furthermore, the amount of green area acts as a key variable contributing to urban resilience, psychological well-being, and stress reduction [22~25]. Meanwhile, residential and commercial facilities indirectly influence mental health by being directly linked to the quality of the living environment [8].
Finally, planned facility characteristics include schools and cultural, sports, welfare, and medical facilities. Numerous studies have suggested that the density of cultural and sports facilities positively impacts the mental health of local residents. Liu and Wei (2023) predicted that offering public sports and cultural programs would improve residents’ mental health. They conducted a multilevel regression analysis targeting Guangzhou City in Guangdong Province and found that increasing the accessibility of sports facilities and recreational spaces positively impacts the mental health of local residents [35]. In their empirical study examining changes in local environmental factors affecting depression levels immediately before and after the COVID-19 pandemic, Kim et al. (2024) used the number of village sports facilities per thousand residents as one variable representing local characteristics. An analysis revealed a positive correlation between depression and stress caused by infectious diseases since the beginning of the pandemic—psychological distress accompanied such situations [36].
Based on previous studies, key urban environment indicators were categorized into three main groups: spatial environment characteristics (air pollution level, building density, and walkability); land-use characteristics (land-use mix, green area ratio, residential area ratio, and commercial area ratio); and planned facility characteristics (schools, cultural facilities, sports facilities, welfare facilities, and medical facilities). This was followed by the identification of detailed variables for each category.
2.3. Strengths of this Study
This study set the following research direction to differentiate itself from existing studies by addressing their limitations. First, existing mental health measurements used a limited range of single variables, such as depression. Conversely, this study used a broader range of mental disorders as dependent variables, including suicide risk, depression, anxiety disorders, and perceived stress, which enabled the derivation of generalizable research findings. Second, while previous studies used samples constrained to specific cities or regions, potentially reflecting localized effects, this study amalgamated a nationally representative sample with urban environmental data at the city, county, and district level across South Korea, facilitating the identification of general trends that supersede regional particularities.
This study addressed the limitations of existing research findings through the implementation of a differentiated analytical model and a re-examination of the external validity and generalizability of the research results.
3. Methods
3.1. Scope of the Study
This study used data from the 9th KNHANES4) conducted by KDCA (2022 data), 2021 Urban Planning Status and Building Register Statistics provided by the Ministry of Land, Infrastructure and Transport, 2021 Air Pollution Status data provided by the Ministry of Environment, and 2021 Q4 National Hospitals and Clinics Status data provided by the HIRA.
The KNHANES sample was selected from 192 survey districts nationwide, with the systematic enrollment of 25 households per district. The primary data source for this study comprised responses from 6,265 adults aged 19 years and older. Moreover, data pertaining to physical environmental factors was collected based on 229 cities, counties, and districts. Building registry statistics were collected using the Building Lifecycle Management System of the Ministry of Land, Infrastructure and Transport. Data were aggregated annually as of December 31 to ensure comprehensive representation of the relevant year. Therefore, the 2021 Building Register statistics, the preceding data for the 2022 KNHANES, were included in the analysis to align the time periods of the two primary datasets. Furthermore, air pollution status data for measuring the air pollution level, along with the nationwide hospital and clinic status map for measuring the number of hospitals and clinics nationwide, were analyzed using data from the same period.
The physical environmental factor data for this study were constructed based on 229 cities, counties, and districts nationwide. However, the study extracted and used only data from the 130 cities, counties, and districts where the 192 survey districts of the KNHANES respondents were located. This approach ensured the validity of the analysis results by coherently connecting the spatial units of the survey district-level response data and the city, county, and district-level environmental data.
3.2. Variable Setting
To identify the urban physical environmental factors affecting mental health, relevant factors were established based on a literature review. The final set of variables used for analysis included four mental health and 17 physical environmental factors, which were classified into three categories, with the variable details shown in Table 1. The rationale behind the selection of diverse mental health indicators as dependent variables was to empirically assess the hypothesis that each mental health indicator was influenced by distinct urban environmental factors.

Results of logistic regression analysis
While demographic characteristics and individual health traits were potential factors that could influence mental health, they were not included as control variables in the model because they could distort the relationship between the physical environmental factors of the city and mental health that this study sought to identify.
For statistical verification of the assumption that different physical environmental factors in cities affected various mental health variables, this study categorized mental health variables into suicide risk, depression, anxiety disorders, and perceived stress. The dependent variable, mental health factors, was constructed as a dichotomous variable using KNHANES data.
Suicide risk was classified as “suicide risk present” if the respondent answered “yes” to one or more of the following: “thought about suicide in the past year,” “planned suicide in the past year,” or “attempted suicide in the past year.”
Depression was assessed using responses to the PHQ-95) questionnaire. The survey comprised nine items on experiences over a two-week period, including the following: “little interest or pleasure in work,” “feelings of being down, depressed, or hopeless,” “difficulty falling asleep, frequent waking, or sleeping too much,” “fatigue or loss of energy,” “loss of appetite or overeating,” “feeling like a bad person or a failure, or that I or my family is unhappy because of me,” “difficulty concentrating while reading the newspaper or watching TV,” “slowness in movement or speech noticeable to others,” “feeling so restless and agitated that I pace or fidget more than usual,” and “thoughts such as ‘I’d rather die’ or thoughts of harming oneself in some way.” The responses were scored as follows: 0 to 2 points for “never”; 1 point for “several days”; 2 points for “a week or longer”; 3 points for “almost every day.” A total score of 10 points or higher indicates relatively frequent experiences of depression, suggesting the need for careful observation and attention. In this study, a score of 10 or higher was classified as “depression present.”
Anxiety disorders were assessed using the GAD-76) questionnaire. The survey comprised seven items on experiences over a two-week period, including “I feel anxious, worried, or on edge,” “I cannot stop or control worrying,” “I worry excessively about many things,” “It is difficult to relax,” “I feel restless and find it hard to sit still,” “I get irritated or angry easily,” and “I feel afraid as if something terrible is going to happen.” The responses were scored as follows: 0 points for “not bothered at all”; 1 point for “bothered for a few days”; 2 points for “disturbed for 7 days or more”; and 3 points for “disturbed almost every day.” A total score of 5 points or higher indicates worry and anxiety, suggesting the need for careful observation and attention. In this study, a score of 5 or higher was classified as “anxiety disorder present.”
Perceived stress was categorized based on responses to the usual level of stress perceived. Those who responded with “I feel very stressed” or “I feel quite stressed” were classified under “high perceived stress,” while those who responded with “I feel somewhat stressed” or “I hardly feel stressed” were categorized under “low perceived stress.”
For specific setting of explanatory variables affecting mental health indicators, urban physical environmental factors, categorized as spatial environment, land-use, and planned facility characteristics, were the independent variables. The data were collected based on 229 cities, counties, and districts. Prior to analysis, variance inflation factors (VIF) were calculated to check for multicollinearity, ensuring that no high correlations existed among the independent variables.
The spatial environment characteristics represent a set of variables reflecting the three-dimensional structure of a city, incorporating height in addition to its planar composition, including the air pollution level, building density, and walkability. The air pollution level was calculated and used by determining the Comprehensive Air-Quality Index (CAI) score based on six air pollutants: particulate matter (PM10), fine particulate matter (PM2.5), ozone, sulfur dioxide, nitrogen dioxide, and carbon monoxide, collected from the air pollution status data provided by the Ministry of Environment. Building density was calculated using the percentage value obtained by dividing the total floor area of buildings within the area by the area of the region, utilizing building registry statistics provided by the Ministry of Land, Infrastructure and Transport to measure development density. The walkability was calculated as the percentage value obtained by dividing the sum of the lengths of pedestrian-only roads, pedestrian-priority roads, and bicycle paths within the area by the total length of all roads within the area, leveraging the urban planning status data from the Ministry of Land, Infrastructure and Transport to determine the ratio of roads allocated to pedestrians.
The land-use characteristics were defined as a set of variables reflecting the composition ratio of land-use areas established in the urban management plan to analyze the impact of the land allocation structure within the city on the mental health of local residents. These characteristics included the land-use mix, green area ratio, residential area ratio, and commercial area ratio. The calculation of these variables was based on the land-use area system, which restricts land use, building coverage ratio, floor area ratio, height, and other factors for the planned and efficient use of national territory. Among the land-use areas, including urban, management, agricultural and forestry, and natural environment conservation areas, only areas within the urban area category were included in the analysis. The land-use mix used the entropy index, which is widely used in urban planning and transportation fields, citing the research by Frank and Pivo(1994) [37]. In this study, the index values were calculated based on the ratio of land area by use type across the residential, commercial, industrial, and green areas. The index value ranged from 0 to 1, with a value closer to 1 indicating a higher degree of mixed land use. The green area, residential area, and commercial area ratios were calculated by dividing the area of each land-use area by the total area of the urban area within the respective city, county, or district and used as variables. The data used to calculate variable values were sourced from the urban planning statistics of the Ministry of Land, Infrastructure and Transport.
The planned facility characteristics were a set of variables designed to measure local residents’ accessibility to groups of facilities related to mental health, including schools and cultural, sports, welfare, and medical facilities. This study categorized and analyzed these variables in two ways: area- and location-based variables. The former method used area-based variables to assess the physical supply scale of facilities within the city, county, or district. It used per capita school site area and the total cultural, sports, welfare, and medical facility floor areas. The reason for using the site area rather than the floor area for schools was that the school playground was used as a proxy variable for sports and cultural facilities. The latter method used location-based variables to reflect the availability and density of facilities within the region, calculating the number of such facilities per 1,000 people. Using the simple number of facilities without accounting for the differing population sizes across regions could distort the assessment of facility utilization relative to the actual population. Therefore, the number of facilities was standardized according to the population size of each urban area in the analysis. The integration of the two sets of variables used in the facility characteristics was challenging because of discrepancies in measurement methodologies and underlying signification. Thus, each approach was analyzed independently. The area-based variables used data from the urban planning statistics and building registry statistics of the Ministry of Land, Infrastructure and Transport. The location-based variables used data from the urban planning statistics of the Ministry of Land, Infrastructure and Transport and the nationwide hospital and clinic statistics of the HIRA.
The demographic characteristics and individual health factors influencing mental health were selected from those commonly identified in previous studies [7~9,26,36,38]. Demographic characteristics included gender, age, marital status, single-person household status, education level, basic livelihood security recipient status, employment status, household income level, housing type, and home ownership status. Personal health characteristics included body mass index (BMI), alcohol consumption status, smoking status, average sleep duration per day, number of days walked per week, vigorous physical activity per week, moderate physical activity per week, and self-rated health status. The variables used for analysis were based on the KNHANES data.
3.3. Analysis Methods
This study used a multilevel logistic regression model to analyze the urban physical environmental factors influencing mental health indicators, which were set as the dependent variable. This was intended to use individual-level data from 6,265 respondents of the 2022 KNHANES and regional-level data from the 130 cities, counties, and districts to which each individual resided. The data used in this study encompass individual-level (Level 1) and regional-level data (Level 2), which are methodically arranged in a hierarchical structure. The failure to reflect this structure and the execution of analyses at a singular level may result in ecological fallacy [7].
The dependent variables encompassed four dichotomous mental health indicators: suicide risk, depression, anxiety disorder, and perceived stress [38]. Each indicator was analyzed individually in independent models. This allowed for an examination of the influence of urban physical environmental factors on different mental health indicators.
The planned facility variables among the independent variables were divided into two distinct categories and analyzed independently. One variable reflects the physical supply scale of facilities within the region based on per capita area, while the other variable reflects the accessibility of facilities considering population size based on the number of facilities per 1,000 people. The two variables, despite their relevance to the same facility, exhibited discrepancies in measurement units and implications, complicating their incorporation into a unified model. These models were evaluated based on their capacity to reflect diverse aspects of urban planning facilities. Consequently, they were categorized into distinct models for analysis.
4. Results
4.1. Descriptive Statistics
The descriptive statistics for the dependent variables used in the analysis are delineated in Table 2. In terms of suicide risk, excluding missing values, 4.34% of all respondents reported having contemplated, planned, or attempted suicide, while 95.53% reported not having engaged in such behaviors. Depression was identified in 26.34% of cases based on PHQ-9 scores as requiring careful observation and attention, while 73.66% were classified as being at a safe level. Anxiety disorders revealed that 30.22% of the GAP-7 scores fell into a category requiring careful observation and attention, while 69.78% were classified as safe. Regarding perceived stress, 24.19% of the participants indicated that they experienced significant levels of stress, whereas 75.83% reported minimal stress levels.
Descriptive statistics for dummy variables
While the proportion of respondents experiencing suicidal risk was not significant, one in three individuals demonstrated symptoms of depression, anxiety disorders, and perceived stress.
The basic statistics for the independent variables of the urban physical environment factors are shown in Table 3. Among spatial environmental variables, air pollution levels showed a minimum value of 50 points and a maximum value of 74 points, indicating regional variation. Building density exhibited notable regional disparities in development levels, with values ranging from a minimum of 0.454% to a maximum of 160/703%. The analysis of walkability indicated a minimum value of 0, suggesting the absence of pedestrian road infrastructure in specific areas.
Descriptive statistics for continuous variables
Among the various land-use variables, the entropy index is regarded as a reliable indicator of areas used for diverse purposes as values approach 1. The observed range, which extended from a minimum value of 0.20 to a maximum value of 0.94, indicated a substantial degree of regional variation. Furthermore, the green area ratio showed significant regional variation, ranging from a minimum of 2.69% to a maximum of 92.84%. Similarly, the residential area ratio varied significantly, with a minimum of 4.64% and a maximum of 91.50%. The commercial area ratio also exhibited an uneven distribution across regions.
The planned facility variables were analyzed based on per capita area and number of facilities per 1,000 people. In terms of per capita area, schools showed a minimum of 0.91m2 and maximum of 56.31m2, whereas cultural facilities showed a minimum of 0.30m2 and maximum of 24.58m2, indicating significant regional disparities. Moreover, as the mean values for the two facilities are 8.38m2 and 3.73m2, respectively, substantial facilities have been established in specific areas. A similar yet comparatively negligible degree of divergence was identified in sports, welfare, and medical facilities across different regions.
A subsequent examination of the number of facilities per 1,000 residents revealed that medical facilities exhibited the most significant variation between regions compared to other facility variables, with a minimum of 0.13 facilities and a maximum of 5.26 facilities. Schools also exhibited relatively large regional differences, ranging from a minimum of 0.03 facilities to a maximum of 1.61 facilities. The mean values for the two variables in this case are 1.58 and 0.30 locations, respectively—a considerable number of facilities have been established in specific regions. Cultural, sports, and welfare facilities demonstrated similar regional disparities, although these variations appeared limited in scope.
4.2. Analysis of Influencing Factors
A multilevel logistic regression analysis with a two-level structure (individual-area) was conducted to examine the impact of urban physical environmental factors on mental health, using four mental health indicators, including suicide risk, depression, anxiety disorders, and perceived stress, as dependent variables. Furthermore, for analyzing urban planning facilities, two models were used in this study: the first model was based on the per capita area of the facility, whereas the second was based on the number of facilities per 1,000 people.
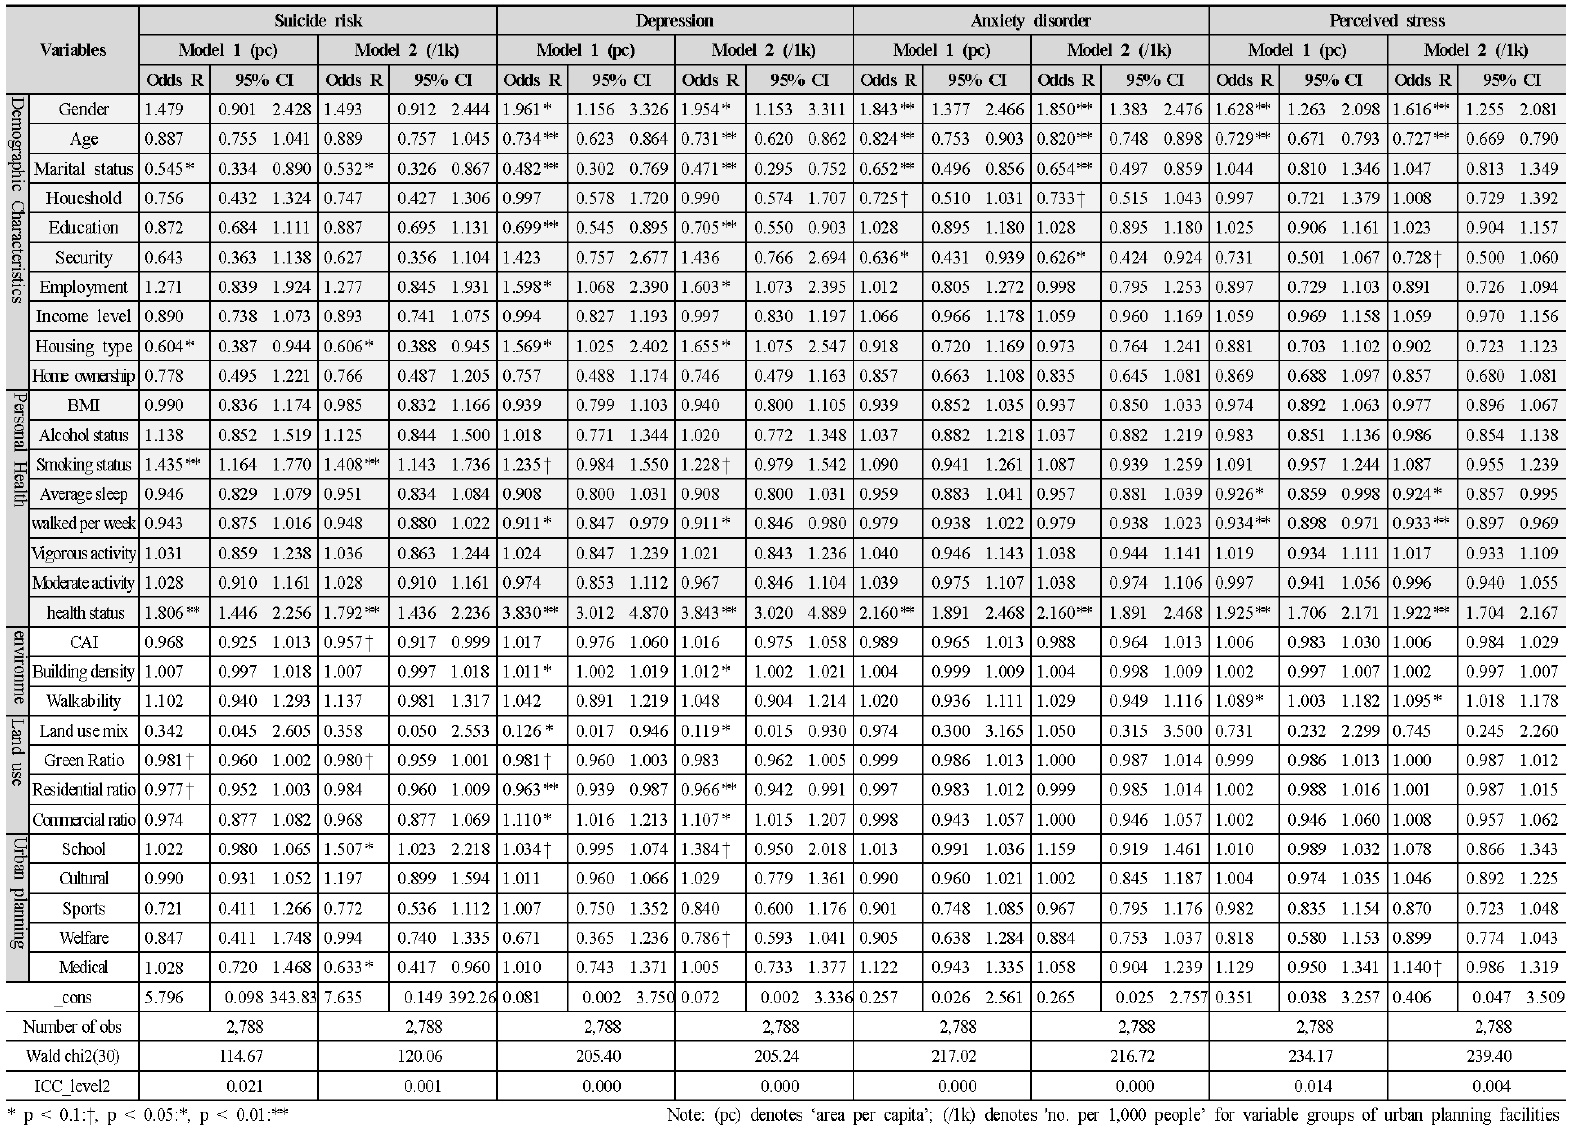
When examining the results of the analysis with suicide risk as the dependent variable, no statistically significant variables appeared in Model 1. In Model 2, air pollution levels (p=0.050), number of schools (p=0.038), and number of medical facilities (p=0.032) were statistically significant. Although a lower air pollution level has been associated with a higher risk of suicide (OR=0.957, 95% CI=0.917-0.999), exercising caution is important when interpreting these results, as the upper limit of the confidence interval is extremely close to 1. Furthermore, suicide risk increased with a higher number of schools per 1,000 people (OR=1.507, 95% CI=1.023-2.218) and a lower number of medical facilities (OR=0.633, 95% CI=0.417-0.960). The significance levels for the green area (p=0.082) and residential area (p=0.088) ratios in Model 1 and those for walkability (p=0.088) and green area ratio (p=0.085) in Model 2 were relatively low but significant. However, as the confidence intervals for all four variables included 1, the results were interpreted as statistically inconsistent.
The analysis with depression as the dependent variable showed that in Models 1 and 2, building density (p=0.013/p=0.013), land-use mix (p=0.044/p=0.042), residential area ratio (p=0.003/p=0.008), and commercial area ratio (p=0.022/p=0.021) were common significant variables. The probability of developing depression increased with increasing building density (OR=1.011, 95% CI=1.002-1.019/OR=1.012, 95% CI=1.002-1.021). Consequently, as the land-use mix declined, a concomitant increase appeared in the probability of developing depression (OR=0.126, 95% CI=0.017-0.946; OR=0.119, 95% CI=0.015-0.930). Furthermore, a lower residential ratio (OR=0.963, 95% CI=0.939-0.987/OR=0.966, 95% CI=0.942-0.991) and higher commercial ratio (OR=1.110, 95% CI=1.016-1.213/OR=1.107, 95% CI=1.015-1.207) were found to be associated with increased depression risk. The green area ratio (p=0.090) and number of schools (p=0.089) in Model 1 and the number of welfare facilities (p=0.093) in Model 2 showed relatively low significance levels. Nonetheless, as the confidence intervals for all four variables included 1, the results seemed statistically inconsistent.
The analysis with anxiety disorders as the dependent variable revealed no statistically significant variables among the urban physical environment variables in either model.
When stress perception was analyzed as the dependent variable, mobility emerged as a statistically significant variable in Models 1 and 2 (p=0.041/p=0.015). Longer pedestrian-priority roads (OR=1.089, 95% CI=1.003-1.182/OR=1.095, 95% CI=1.018-1.178) were associated with increased perceived stress. However, the confidence intervals included 1, indicating statistically inconsistent results. In Model 2, the number of medical facilities (p=0.077) showed a relatively low level of significance.
Results of logistic regression analysis
5. Discussion
This study investigated the effects of urban physical environmental factors, divided into spatial environment, land use, and facility density, on four mental health indicators. Consequently, suicide risk showed a statistically significant correlation with the air pollution level, number of schools, and number of medical facilities. Depression showed a significant correlation with building density, land-use mix, residential area ratio, and commercial area ratio. Perceived stress showed a significant correlation with walkability. Conversely, for anxiety disorders, no variables showed a relationship with the urban physical environmental factors. Thus, as hypothesized in this study, urban physical environmental factors had different effects on each mental health indicator.
The findings of the analysis demonstrated that mental health has multidimensional characteristics, rendering it challenging to identify influencing factors using an analysis based on a single indicator. Furthermore, the urban physical environment factors could have differing effects depending on the mental health indicator. Therefore, understanding the impact of urban physical environmental factors on mental health requires a comprehensive analysis considering multiple mental health indicators—approaches based solely on specific mental disorders have limitations. The following is a comprehensive evaluation of mental health indicators.
First, the findings indicated that an elevated air pollution level led to a reduced suicide risk. Previous studies using air pollutant emissions as explanatory variables reported that higher sulfur dioxide (SO2) and ozone (O3) emissions were associated with an increased probability of developing depression [39]. However, the results of the analysis in this study contradict those of previous research. This discrepancy may be attributed to the use of an air pollution index in this study, which was developed with the consideration of human health risks and perceived pollution levels based on air pollution levels rather than the fragmented air pollutant emission amounts used in previous studies. The areas exhibiting relatively elevated air pollution levels were predominantly medium-sized or larger cities where large metropolitan areas and industrial areas coexisted or where transportation infrastructure was densely concentrated. These regions frequently exhibited a certain degree of infrastructure and transportation network development. These areas could have relatively high urban connectivity, such as road accessibility and proximity to activity hubs, even if their air quality remained poor. To a certain extent, these urban spatial characteristics appeared to offset the sense of disconnection or isolation experienced by local residents [40]. The association between air pollution levels and suicide risk may not be attributable to the inherent harm of the pollutants themselves. Rather, the relationship could be a secondary characteristic of urban spatial structures that are concomitant with air pollution.
Regarding the number of schools, the findings indicated that the suicide risk increased with the number of schools. In this study, the school playground was used as a proxy variable based on prior research findings indicating a statistically significant positive relationship between schools and low-intensity physical activity, suggesting a strong association with light physical activities among local residents, such as walking or jogging [35]. Nevertheless, while schools could be used as a proxy variable for light physical activity, schools themselves were not interpreted as having a positive impact on mental health. Schools served as hubs of community activity during the day. However, in South Korea, they were often used only for student-centered activities, preventing them from functioning as everyday spaces where the general public could relax or recover emotionally.
Concerning the number of medical facilities, a significant decrease in the suicide risk was observed with an increase in the number of medical facilities. This may have been because of areas with a higher concentration of medical facilities also had relatively improved access to mental health-related medical services, enabling medical interventions such as the early detection and treatment of severe mental health issues that posed a higher suicide risk. Mental health issues could significantly vary in prognosis depending on the availability of early intervention [41]. Furthermore, even without direct medical intervention, the mere presence of medical facilities within the community was expected to provide residents with a sense of emotional security by instilling awareness that medical services were available in emergencies. Access to healthcare seemed to offer more than merely tangible treatment opportunities. It was also perceived as a psychological safety net that could positively impact mental health.
Second, the analysis of depression revealed that the probability of developing depression significantly increased with higher building density. Thus, the increase in physical environmental factors accompanying higher building density within cities could exacerbate emotional fatigue and psychological pressure among local residents. The increase in building density is often coupled with an increase in population density, which can contribute to the accumulation of various negative environmental factors such as crowded living spaces, noise levels, traffic congestion, and a shortage of public spaces [42]. Additionally, areas with high building density have relatively low access to green areas and natural environments, with limited opportunities for exposure to nature. Such environments may contribute to impeded stress recovery by blocking opportunities for nature exposure essential for mental restoration [22~25].
The analysis of land-use mix revealed that a higher degree of land-use mix significantly reduced the probability of developing depression. These findings suggested that environments where diverse land uses coexisted could mitigate the risk of depression stemming from feelings of isolation or monotony, compared to areas composed of single land uses. A previous study targeting counties in the northwestern and southeastern counties in the United States has also reported that mixed-use areas can improve mental health by enhancing residents’ access to local resources, daily living services, and recreational facilities, meeting their needs and promoting outdoor activities and social interaction [43].
Regarding land-use ratios, the probability of developing depression showed a significant increase with a lower residential area ratio and a higher commercial area ratio. Residential areas are considered the ratio of land within a city where individuals may stay safe and protected. Housing is linked to the basic human needs for survival and safety. A stable residential foundation is one of the cornerstones of emotional security. In this study, the negative relationship between depression and residential area ratio could be interpreted as a result of this emotional stability foundation being partially reflected in the composition of urban areas. Conversely, commercial districts are places with a high concentration of various external stimuli, such as high foot traffic, heavy traffic volume, and noise. A situation with many external stimuli can lead to mental fatigue and emotional exhaustion. In this study, the positive relationship observed between depression and the commercial area ratio was interpreted as reflecting these urban spatial characteristics. This implied that the composition ratio, considering the spatial characteristics of land use, such as residential and commercial areas, combined with the land-use mix, could influence the occurrence of depression in combination.
Third, no statistically significant physical environmental factors were found in either model when anxiety disorders were used as the dependent variable. Thus, the nature of anxiety as a mental health indicator was not directly influenced by the physical environment but was indirectly affected through the cognitive experiences shaped by that environment. According to Evans (2003), the built environment influences mental health through three psychological pathways: individual locus of control, formation of social support, and psychological resilience. This explains that psychological distress increases in the following places: where individuals cannot control the physical environment, such as noise, congestion, and spatial fragmentation; where roads and housing restrict social interaction in crowded settings; and where natural elements and designed built environments that aid recovery from fatigue and stress are limited [6].
Fourth, the analysis using perceived stress as the dependent variable revealed that an increase in walkability was associated with an increase in perceived stress. A study examining the association between walkability and depression in the northwestern region of the United States showed that men residing in walkable neighborhoods showed a reduced probability of developing severe depressive symptoms [39]. A domestic study conducted in Incheon reported that longer bicycle lane lengths were associated with higher satisfaction with quality of life [44]. Furthermore, an empirical study examining environmental factors that influence depression before and after the pandemic found that, while the ratio of pedestrian-priority road area did not significantly affect depression before the pandemic, it showed a negative correlation with depression, eventually achieving statistical significance during the post-pandemic period [36]. Nevertheless, the results in this study showed the opposite of those found in previous studies when the ratio of pedestrian-priority road length to total road length was used as an explanatory variable to analyze its relationship with perceived stress. These results may have been attributed to limitations in data collection during the process of establishing the walkability variables used in this study. The 2021 urban planning statistics data from the Ministry of Land, Infrastructure and Transport used in the analysis showed pedestrian-priority road areas recorded as “0” for some regions. This was judged to be the result of the presence of numerous roads not designated as pedestrian-priority roads rather than indicating the absence of pedestrian-priority roads in those areas. In particular, narrow roads with a width of less than 12 m are classified as general roads; nonetheless, in practice, they are often used by pedestrians. As such, the actual pedestrian environment may not have been fully reflected in the statistics because of not being classified as pedestrian roads under legal standards. This structural limitation may be one of the key factors contributing to the conflicting results between perceived stress and walkability in this study and is a significant limitation of the research. Future research should use more sophisticated empirical methods utilizing actual street status data in addition to simple administrative statistics-based data.
When comprehensively considering the interpretations of these mental health indicators, the urban physical environment contributed in different ways depending on specific aspects of mental health. This study applied a multilevel logistic regression model to analyze the data. The analysis was conducted by distinguishing between Models 1 and 2 based on the measurement methods for the detailed variables of the planned facility characteristics. The analysis results showed that most of the significant variables in Model 1 remained significant in Model 2 in the same direction. Additionally, Model 2 identified additional significant variables. Model 1 was established based on the per capita gross floor area of planned facilities, serving as an indicator reflecting the supply level in terms of area, showing how physically developed planned facilities are within the city. Model 2 was established based on the number of facilities per 1,000 residents and serves as an indicator of the accessibility of these facilities for local residents. The results of this analysis suggest that a planning strategy that considers accessibility and expansion of a facility area may be more effective for mental health than a strategy that focuses solely on increasing a facility area. However, given the limitations of the analytical design and data composition of this study, caution should be exercised before definitively generalizing this interpretation.
Although this study sought to identify generalizable factors by combining urban environmental variables and mental health indicators at the city, county, and district levels nationwide, several structural limitations were identified during the process. First, some of the urban environmental variables used in the analysis were collected as values of “0” in specific regions or showed significant variations between regions. Consequently, instances of instability in estimation and ambiguity in the interpretation of confidence intervals occurred. Although the significance probability met the threshold, a confidence interval containing 1 indicated that caution in interpreting the results was necessary, even if the effect of the variable was statistically significant. These results may have been because of aspects such as administrative statistics-based data failing to reflect the actual urban environment adequately. Second, as this study aimed to identify general urban environmental effects through nationwide analysis without being confined to the particularities of specific regions, it did not account for heterogeneity among urban types such as rural and urban areas or regions with concentrated specific industries. This approach held significance in ensuring representativeness within the spatial scope of the research; however, it was also limited by not sufficiently reflecting regional characteristics. Therefore, future studies shall use the results of this research as foundational data and conduct a comparative analysis broken down by urban type, examining the structural relationships between models more precisely.
The findings of this study demonstrate that the physical environment of a city can influence mental health indicators in distinct ways, representing a foundational attempt in this area of research. These findings suggest the need for urban planners to consider various environmental factors that impact mental health. Comprehensive consideration of various factors, such as the distribution characteristics of variables, limitations of the data, and heterogeneity among urban types, are required for more systematic and sophisticated follow-up research.
6. Conclusion
This study empirically investigated the impact of urban physical environmental factors on the mental health of local residents. Therefore, a multilevel logistic regression analysis was conducted using the nationwide city, county, and district-level urban environment data and KNHANES data, using four mental health indicators—suicide risk, depression, anxiety disorder, and perceived stress—as dependent variables.
The analysis revealed that suicide risk showed a significant correlation with the air pollution level, number of schools, and number of medical facilities. Depression was significantly associated with the building density, land-use mix, residential area ratio, and commercial area ratio. Perceived stress showed a statistically significant correlation with walkability. These findings supported the hypothesis of this study that physical environmental factors in cities would have different effects on each mental health indicator.
This study was distinguished from previous research in that it approached mental health as a multidimensional concept rather than a single indicator, empirically analyzed urban physical environmental factors by detailed classification, and used an analytical model using a nationwide sample rather than a specific region to enhance the generalizability of the results.
However, the following limitations arose from the research design and data composition. First, this study used statistical data rather than actual measurement data. This resulted in significant regional disparities and data imbalances, including instances where variable values were recorded as “0” in certain specific regions, as well as missing data issues. As this introduced uncertainty in interpretation, careful analysis of the results is warranted. Furthermore, this study was limited in that it conducted analyses to derive generalized results at the national level and did not account for heterogeneous characteristics between regions, such as urban and rural areas. To address these limitations, the indicators were conceptualized as comparable numerical variables for analysis. These indicators included land-use area ratios to the urban area, per capita area of planned facilities, and number of planned facilities per 1,000 people. Nonetheless, this approach did not fully reflect the unique characteristics of each region. Therefore, future studies may need to use more sophisticated analyses, such as categorizing cities by type, considering that even the same physical factors may affect residents’ mental health differently depending on the urban characteristics.
Nevertheless, this study empirically demonstrated the differential impact of urban physical environmental factors on mental health indicators, providing foundational data for future research in this area. Furthermore, the findings of this study are expected to serve as a foundation for clarifying the relationship between urban physical environmental factors and mental health using comparative studies reflecting the scale and structural characteristics of cities or time-series analyses considering long-term change trends.
Notes
References
- National Center of Mental Health, Ministry of Health and Welfare, Report on the results of the 2024 National Mental Health Knowledge and Attitude Survey, No.11-1352629-000168-11, 2024.
- Statistics Korea, 2022 Annual report on the causes of death statistics, 2023.
-
M.T. Tsuang, Genes, environment, and mental health wellness, American Journal of Psychiatry, 157(4), 2000.04, pp.489-491.
[https://doi.org/10.1176/appi.ajp.157.4.489]

- N.E. Gu, The effects of neighborhood built environment on mental health: A systematic review of Korean studies, Journal of the Architectural Institute of Korea, 39(10), 2023.10, pp.27-38.
-
Y.J. Lim, A research review of urban environment factors affecting mental health, SH Urban Research & Insight, 11(3), 2021.12, pp.79-101.
[https://doi.org/10.26700/shuri.2021.12.11.3.79]
-
G.W. Evans, The built environment and mental health, Journal of Urban Health, 80(4), 2003, pp.536-555.
[https://doi.org/10.1093/jurban/jtg063]
- E.J. Kim, M.G. Kang, Effects of built environment and individual characteristics on health condition, Journal of the KRSA, 27(3), 2011.09, pp.27-42.
-
C.G. Lee, S.G. Lee, Analysis of the impacts of neighborhood environment on physical activity and health status in Seoul, Korea - Application of multilevel analysis with the Korea National Health and Nutrition Examination Survey (2007-2012), Journal of Korea Planning Association, 51(3), 2016, pp.217-239.
[https://doi.org/10.17208/jkpa.2016.06.51.3.217]
-
K.D. Park et al., A study on the Effects of individual and household characteristics and built environments on resident’s depression, Journal of Korea Planning Association, 52(3), 2017, pp.93-108.
[https://doi.org/10.17208/jkpa.2017.06.52.3.93]
-
K.W. Kang et al., Effect of residential environment on the health status in apartment inhabitants, Journal of Agricultural Medicine & Community Health, 34(3), 2009.12, pp.279-290.
[https://doi.org/10.5393/JAMCH.2009.34.3.279]
- Y.J. Kim, K.H. Ahn, Influences of neighborhoods physical environments on physical and mental health to the elderly, Journal of the Urban Design Insitute of Korea, 12(6), 2011.12, pp.89-99.
- World Health Organization, Constitution of the World Health Organization, 1948.
- M. Lalonde, A new perspective on the health of Canadians: A working document, Ottawa: Government of Canada, Ministry of National Health and Welfare, 1974.
- World Health Organization, Ottawa Charter for Health Promotion, 1986.
- S.J. Kim, Y.Y. Choi, J.H. Kim, A study on the effects of residential environmental factors on the stress of residents - Focusing on the mediating effects of place attachment and collective efficacy, Journal of the Korean Housing Association, 34(2), 2024, pp.1-10.
- World Health Organization, Investing in mental health, 2003.
- Ministry of Health and Welfare National Center for Mental Health, National Mental Health Survey 2021, No. 11-1352629-000065-01.
- S.B. Lim, Environmental psychology and human behavior: Research on pro-human and pro-environmental architectural design, Korea: Bomoondang, 2007.
- P.S. Bell et al., Environmental psychology (5th ed.), Lawrence Erlbaum Associates, 2005.
- R.G. Barker, Ecological psychology: Concepts and methods for studying the environment of human behavior, Stanford University Press, 1968.
-
A.W. Wicker, Ecological psychology: Some recent and prospective development, American Psychologist, 34(9), 1979, pp.775-795.
[https://doi.org/10.1037//0003-066X.34.9.755]
-
R.S. Ulrich, Visual landscapes and psychological well-being, Landscape Research, 4, 1979, pp.17-23.
[https://doi.org/10.1080/01426397908705892]
-
R.S. Ulrich, View through a window may influence recovery from survey, Science, 224, 1984, pp.420-421.
[https://doi.org/10.1126/science.6143402]
- R. Kaplan, S. Kaplan, The experience of nature: A psychological perspective, Cambridge University Press, 1989.
-
R. Kaplan, The restorative benefits of nature: Toward an integrative framework, Journal of Environmental Psychology, 15, 1995, pp.169-182.
[https://doi.org/10.1016/0272-4944(95)90001-2]
-
Y.I. Nam et al., Analysis of neighborhood environments affecting the residents’ depression: Using the Community Health Survey 2019 and street view image in Gyeonggi Province, Korea, Journal of the Urban Design Insitute of Korea, 24(6), 2023, pp.165-182.
[https://doi.org/10.38195/judik.2023.12.24.6.165]
- World Health Organization, Preventing suicide: A global imperative, 2014.
-
S. Galea et al., Urban built environment and depression: A multilevel analysis, Journal of Epidemiology & Community Health, 59(10), 2005, pp.822-827.
[https://doi.org/10.1136/jech.2005.033084]
-
J. Maas et al., Social contacts as a possible mechanism behind the relation between green space and health, Health & Place, 15(2), 2009, pp.586-595.
[https://doi.org/10.1016/j.healthplace.2008.09.006]
-
J.I. Halonen et al., Associations of traffic noise with self-rated health and psychotropic medication use, Scandinavian Journal of Work, Environment & Health, 2014, pp.235-243.
[https://doi.org/10.5271/sjweh.3408]
-
J.J. Roe et al., Green space and stress: Evidence from cortisol measures in deprived urban communities, International Journal of Environmental Research and Public Health, 10(9), 2013, pp.4086-4103.
[https://doi.org/10.3390/ijerph10094086]
- B. Kamaldeep et al., Air quality and mental health: Evidence, challenges and future directions, Cambridge University Press, 2023, pp.1-12.
-
J.G.C. Laurent et al., Associations between acute exposures to PM2.5 and carbon dioxide indoors and cognitive function in office workers: A multicountry longitudinal prospective observational study, Environmental Research Letters, 16(9), 2021.
[https://doi.org/10.1088/1748-9326/ac1bd8]
- K.H. Lee, K.H. Ahn, Effect of neighborhood environment on resident’s health - A case study of 40 areas in Seoul, Journal of Korea Planning Association, 43(3), 2008, pp. 249-261, 2008, pp.249-261.
-
L. Liu, W. Wei, Influence of public sports services on residents’ mental health at communities level: New insights from China, International Journal of Environmental Research and Public Health, 20(2), 2023, 1143.
[https://doi.org/10.3390/ijerph20021143]
- E.J. Kim, S.Y. Jung, H.J. Jun, The change in the influence of environmental factors on depression by the COVID-19 pandemic, Journal of the Korean Regional Science Association, 40(1), 2024, pp.19-35.
- L.D. Frank, G. Pivo, Relationship between land use and travel behavior in the Puget Sound region, Seattle: Washington State Transportation Center, 1994.
-
Y.S. Lee, A study on the relationship between urban environmental elements and depression - Focused on urban planning strategy in the COVID19 era, Journal of Real Estate Analysis, 6(3), 2020.11, pp.69-88.
[https://doi.org/10.30902/jrea.2020.6.3.69]
-
E.M. Berke et al., Protective association between neighborhood walkability and depression in older men, Journal of the American Geriatrics Society, 55(4), 2007, pp.526-533.
[https://doi.org/10.1111/j.1532-5415.2007.01108.x]
-
Z. Tianyao, C.L.H. Rebecca, H.C. Hung, Suburban neighborhood environments and depression: A case study of Guangzhou, China, Journal of Transport & Health, 15, 2019, 100624.
[https://doi.org/10.1016/j.jth.2019.100624]
-
P.D. McGorry et al., EPPIC: An evolving system of early detection and optimal management, The Journal of Psychoses and Related Disorders, 22(2), 1996, pp.305-326.
[https://doi.org/10.1093/schbul/22.2.305]
-
Z. Zhaoxi et al., Assessing the association between overcrowding and human physiological stress response in different urban contexts: A case study in Salzburg, Austria, International Journal of Health Geographics, 22(15), 2023.
[https://doi.org/10.1186/s12942-023-00334-7]
-
Y.D. Wei et al., Built environment, natural environment, and mental health, GeoHealth, 8, 2024, e2024GH001047.
[https://doi.org/10.1029/2024GH001047]
-
S. An, J. Lee, D. Sohn, Relationship between the built environment in the community and individual health in Incheon, Korea, Journal of Asian Architecture and Building Engineering, 13(1), 2014, pp.171-178.
[https://doi.org/10.3130/jaabe.13.171]