Analysis of the Disaster Risk Assessment for Urban Declining Areas by Applying Weights of Risk Indicators : Focused on Heavy Rainfall and Snow
ⓒ 2021. KIEAE all rights reserved.
Abstract
Declining cities are vulnerable to disasters due to a decrease in population, a decrease in the number of businesses, and the aging of buildings. Residents of declining areas are susceptible to disaster risks, and from an urban planning perspective, it is necessary to identify various disaster risks before establishing regeneration plans for declining areas in various cities. Thus, this paper aims to analyze the risk of disasters in small-scale declining areas in cities that reflect the weights for each disaster risk indicator.
This study calculates disaster risk according to the IPCC disaster risk assessment framework. Based on field surveys and spatial statistics, the collected data are integrated into the grid according to the small-scale declining area to classify the grades and obtain risk scores. Next, after evaluating the importance of each risk indicator through expert advice, the disaster risk is analyzed by assigning weights using AHP analysis. In the developed model, a disaster risk analysis was conducted using weights for each disaster risk factor.
As a result, the quantified evaluation results were displayed in a 10 m grid for each city. The results of considering the weights for each risk indicator were obtained, and the risk of heavy rainfall and snow disasters specific to each region were obtained. It is expected to use the developed methods in this study as a disaster risk analysis for a small declining area in a city.
Keywords:
Declining Area, Urban Regeneration, Disaster Risk Assessment키워드:
쇠퇴지역, 도시재생, 재난위험성 분석1. Introduction
A declining city is an area that is physically and economically lagging and in decline [1]. These cities may be exposed to various risks due to population decline and lack of social infrastructure and are vulnerable to disasters [2].
It is important to analyze disaster risk from a planning perspective because cities exposed to disasters experience setbacks in urban regeneration and planning. Research on disaster risk analysis has been steadily progressing ever since. In 2014, the Intergovernmental Panel on Climate Change (IPCC) in the United Nations proposed a disaster assessment framework model to evaluate the sustainability of urban spaces regarding climate change [3]. This evaluation model was used when analyzing a macroscale urban area. In the past, disaster risk was analyzed by city, county, and local administrative districts, e.g. gu units in Korea, but it is difficult to understand disaster risk for specific areas within the city in the analysis of an entire city [4]. In particular, it can be of great help in terms of urban regeneration and urban planning if the risk of disasters in these small declining areas is identified first.
This paper aims to develop an evaluation model for heavy rainfall and snow disaster risk analysis for a small declining area in urban areas. Based on the IPCC evaluation framework and existing studies [3, 5], disaster risk indices were collected, weights were calculated through the analytic hierarchy process (AHP) analysis after consulting with experts, and disaster risk analysis was performed for declining areas. The risk assessment of the research site is expressed in the form of numerical scores calculated using the developed model. Subsequently, the scores are allocated onto a grid representing the target area with risk assessment. Finally, the heavy rainfall and snow disaster risk scores are visualized using an image.
2. Literature Review
Urban decline due to high unemployment and poverty, housing degradation, and urban infrastructure decay is characterized as the geographical concentration of social, economic, and environmental issues in major cities [6]. The term "urban decline" refers to an urban transition that includes population and employment losses, social isolation, deprivation, and, in some cases, physical degradation [7]. Since urban decline makes the city physically and economically vulnerable, disasters can have a significant impact on the whole city.
The IPCC suggested a framework for disaster vulnerability in 2014 [3]. This framework has presented a risk assessment framework model including social factors. Wang et al. [8] and Visser et al. [9] used the risk assessment framework model to analyze disaster impacts, vulnerability and climate change. The Ministry of Land, Infrastructure and Transport (MLIT) in South Korea also used the IPCC framework for disaster risk assessment in the urban planning process. By analyzing the current and future vulnerabilities, a comprehensive urban disaster vulnerability framework and indicators for the disaster analysis of the entire city were presented [10]. Existing disaster risk studies mainly analyzed the entire city in a macroscale. Lee et al. [11] compared vulnerability analysis and risk assessment methods for flood disasters by comparing yearly results. Disaster vulnerability factors were compared and analyzed focusing mainly on vulnerability, targeting the whole country [12], and potential risks were analyzed using regional heavy snow characteristics. [13]. Won et al. [14] analyzed the factors for the occurrence of heat-related diseases in declining cities and examined the factors of heat wave disasters vulnerabilities to climate change.
Previous studies focusing on declining areas and urban regeneration analyzed vulnerable areas to cope with climate change from the perspective of urban regeneration. Jang and Kim [15] proposed that urban regeneration considering a green community helps resolve complicate urban programs in urban decline and climate change. Park et al. [16] analyzed safety vulnerabilities by selectively applying disaster risks and safety indicators. Yu and Yeo [17] selected climate and energy indicators for responding to climate change in addition to indicators such as population and economic factors for selecting urban regeneration activation areas. While those previous studies focused on wide, large areas, Park et al. [5] analyzed the risk of heavy rain for declining areas at the microscale. However, because weights were not considered when performing the risk analysis, it was hard to apply by other regions.
Therefore, this study seeks to develop a risk assessment method to analyze a declining small area that is more critical to those who live there by risk assessment criteria with appropriate weights.
3. Methods
3.1. Research Site
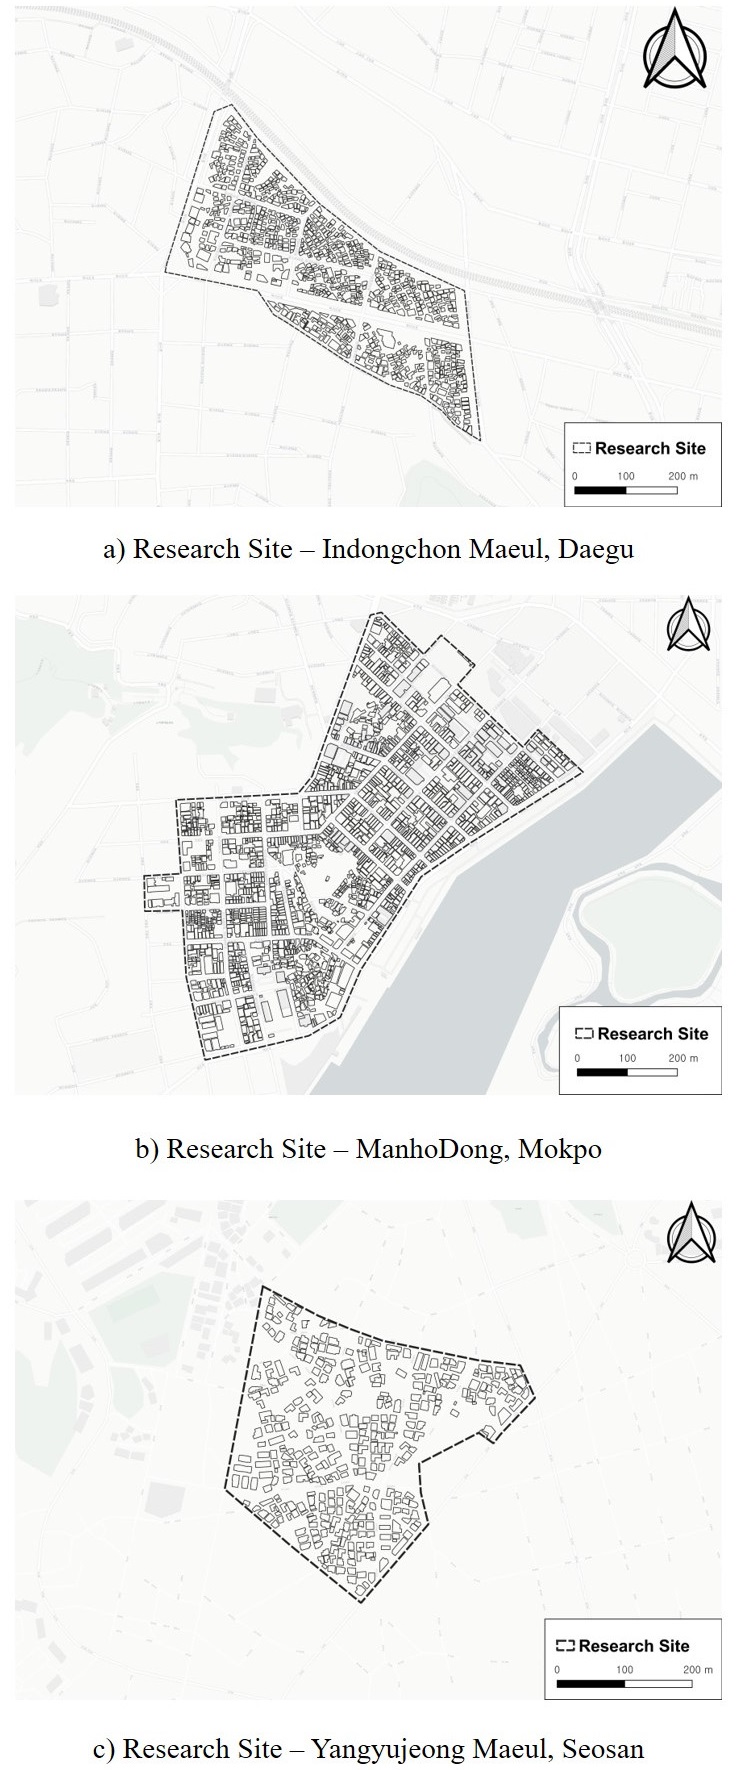
The research sites are the small districts of three declining cities. The three sites have been designated as an urban regeneration area by the Ministry of Land, Infrastructure and Transport in South Korea. The three regions are a) Indongchon Maeul in Daegu Metropolitan City, b) Manho-dong area in Mokpo City, and c) Yangyujeong Maeul in Seosan City (Fig. 1.). Three areas were selected for the implementation of urban regeneration projects based on physical as well as social and economic decline [18].
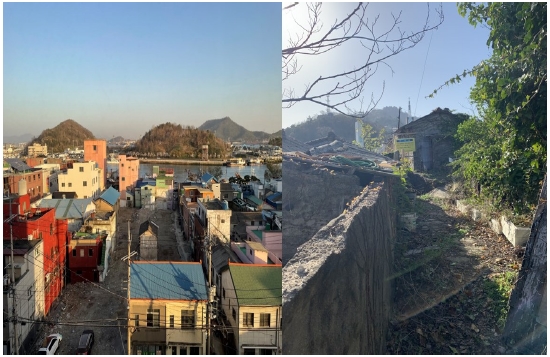
In the three regions, there were social declines, such as a decrease in population and in the number of businesses. Additionally, we determined that there was deterioration in the buildings and facilities, as shown in Fig. 2.
3.2. Data Collecting
In this study, risk assessment factors were classified based on the IPCC disaster risk assessment framework [3]. There are four risk assessment factors: 1) hazard, 2) exposure, 3) vulnerability, and 4) management [3]. Next, three indicators were selected for each risk assessment factor based on the Ministry of Land, Infrastructure and Transport's disaster vulnerability assessment criteria, related works, and a field survey of the research area in accordance with the disaster risk analysis and evaluation of small-scale declining areas (Table 1.). Each risk factor referred to the existing statistical and spatial data and on-site investigations in consideration of its specificity so that it can be used appropriately for disaster risk assessment in small-scale declining areas, and is optimized for the situation of the study site. The rainfall risk indicators were based on a previous study [5], and we considered the heavy snow risk indicators for the distinct characteristics of the research area.
3.3 Risk Assessment
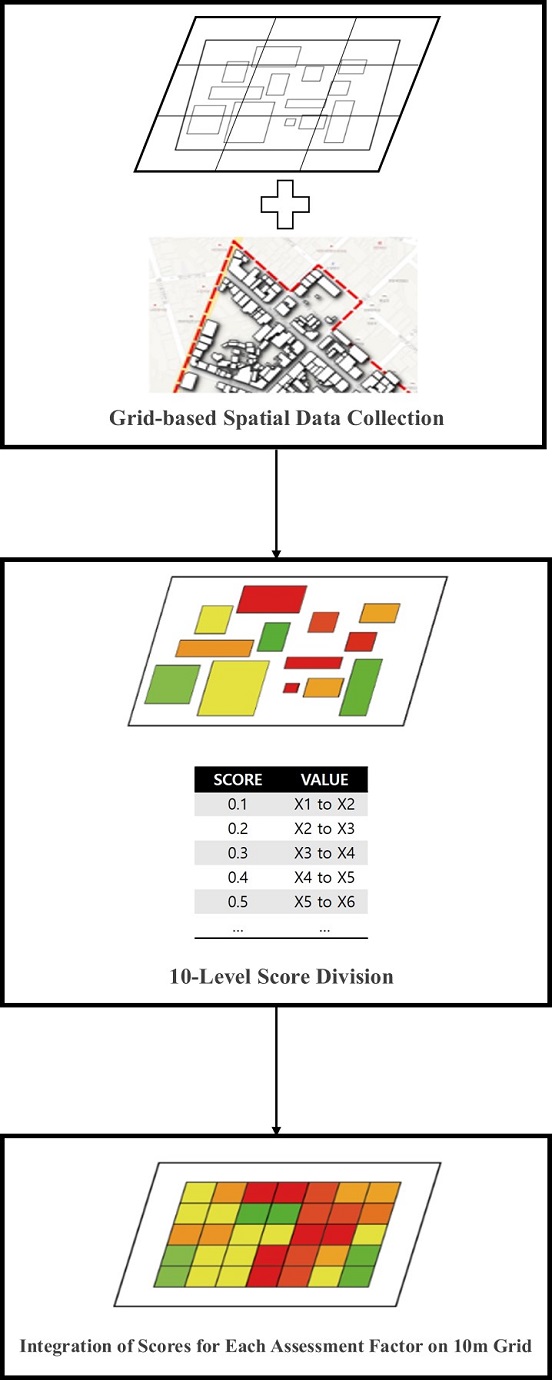
In this study, risk indicators of disaster were collected based on a 1 m grid. The collected risk indicators are scored in 10 levels from 0.1 to 1.0. Additionally, in the case of the hazard factor, which has different data with values by month, five years of data were collected. After collecting the raw data, we scored 10 levels from 0.1 to 1.0 and classified them based on the maximum and minimum values of five years of data. Next, the score was calculated as a five-year average value after the corresponding score was assigned to each monthly risk indicator [5].
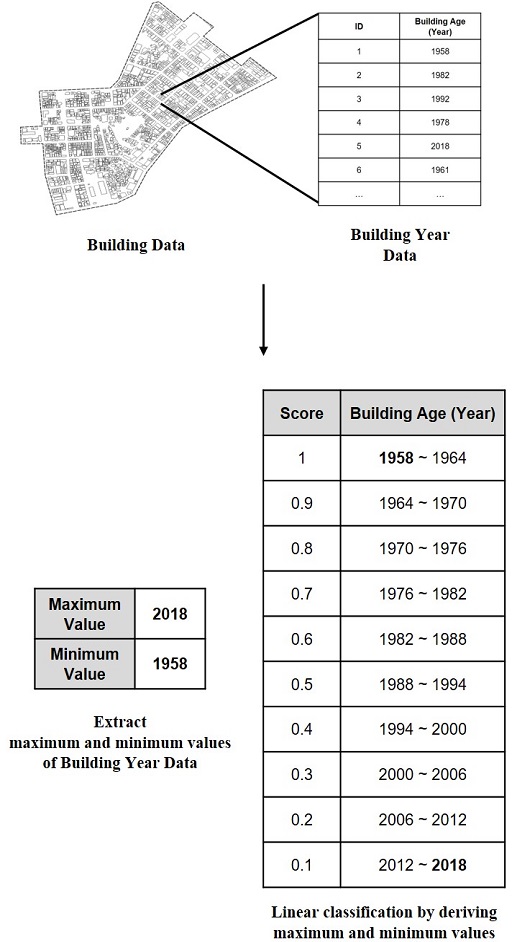
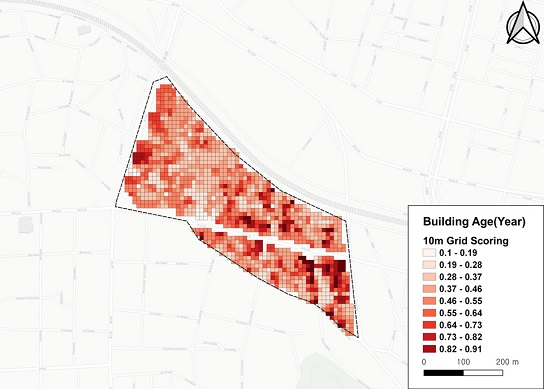
Additionally, other indicators of each risk assessment factor were calculated at equal intervals following a linear classification by deriving maximum and minimum values, and then scores for each evaluation factor were integrated into a 10 m grid to divide the scores into 10 levels (Fig. 3.). Fig. 4. shows an example of 10-level score division process using building age (year) data of heavy rainfall exposure factor. After the processes of scoring and integration, we can get 10 m grid scoring result. Fig. 5. shows the example result of the rainfall indicator building age (year) on a 10 m grid of Daegu.
3.4 AHP Weight Analysis
In this study, AHP analysis was conducted by expert advice for a precise and regionally specific disaster risk analysis. AHP analysis is a technique for selecting alternatives by setting criteria and comparing alternatives by criteria [25]. As an evaluation scale for pair comparison, [How important is Item B based on Item A?] or [How important is Item A is based on Item B?] was evaluated according to a 9-point scale (Fig. 6.). The reason for using the AHP analysis was to reflect the opinions of experts to perform a more precise and regionally specific disaster risk assessment index by assigning weights to each index within the element.
A survey was conducted with 10 experts, and the scored survey results were digitized using Python. The result is obtained as a numerical value that can be applied as a weight to the formula to calculate the risk. Table 2. shows the numerical values of weights.
4. Results
Based on a previous research [5], we obtained the sum of the values of each risk factor scored on a 10 m grid(Hi, Ei, Vi and Mi). Next, the values were multiplied by the AHP weight value(WHi, WEi, WVi and WMi) and applied to the IPCC disaster risk assessment framework model to calculate the total disaster risks (Eq. 1).
| (Eq. 1) |
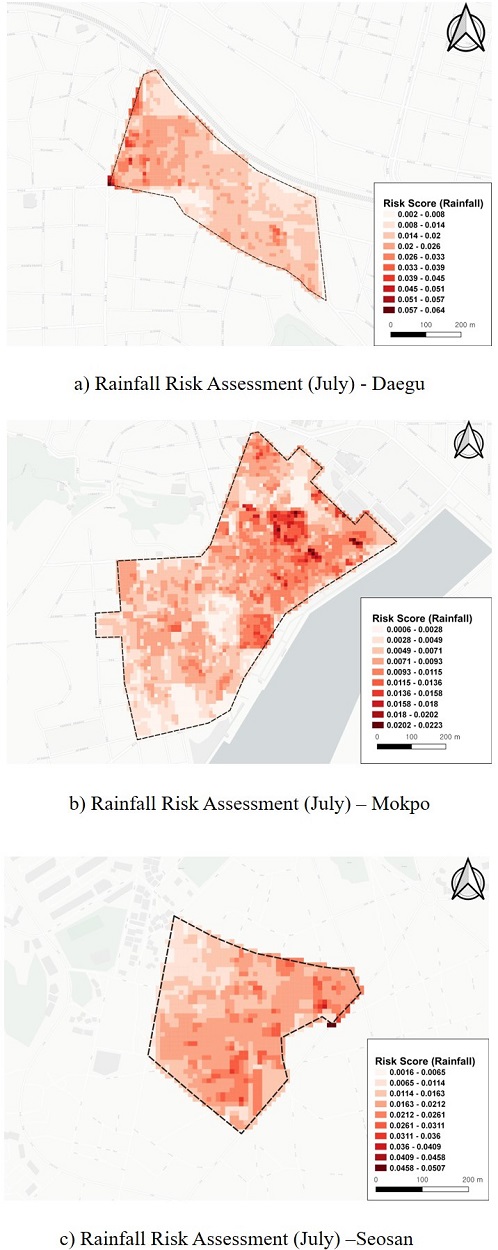
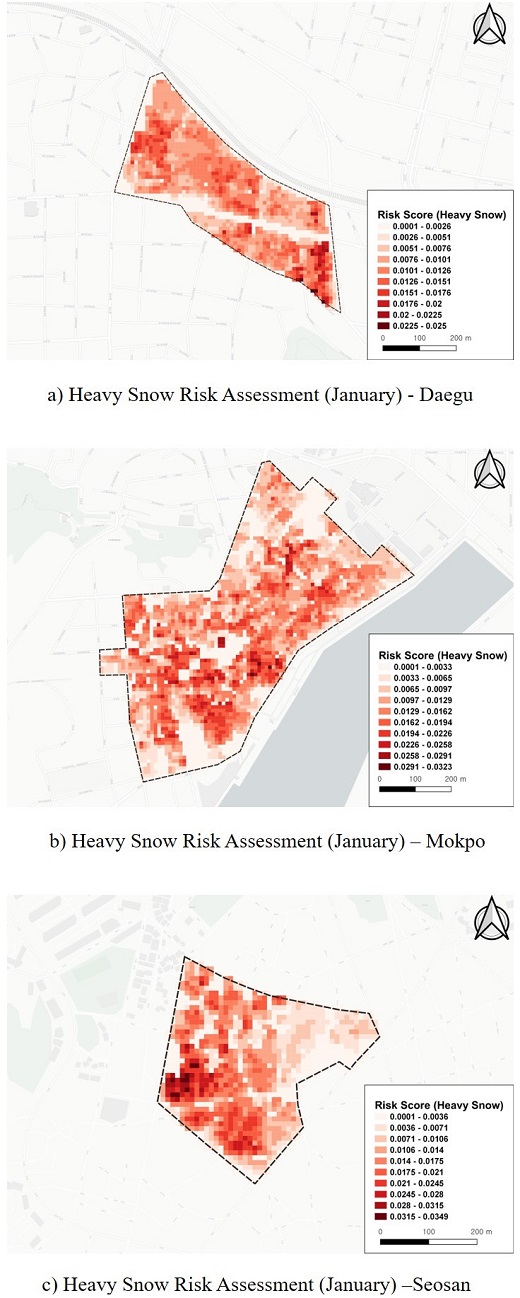
As a result, we obtain the risk assessment score models of heavy rainfall Fig. 7. shows the heavy rainfall risk score, and Fig. 8. shows the heavy snow risk score for each research site.
Fig. 7. shows the results of the heavy rainfall risk assessment model for July. As the hazard factor differs by month, the results also vary by month. We selected the heavy rainfall risk scores of July as a representative month result that has the highest score.
Fig. 8. shows the scores of the heavy snow risk assessment model for January. As the hazard factor of heavy snow also differs by month, the results vary by month, similar to the rainfall disasters. Representatively, we selected the highest risk scores of the January result when considering the seasonal characteristics.
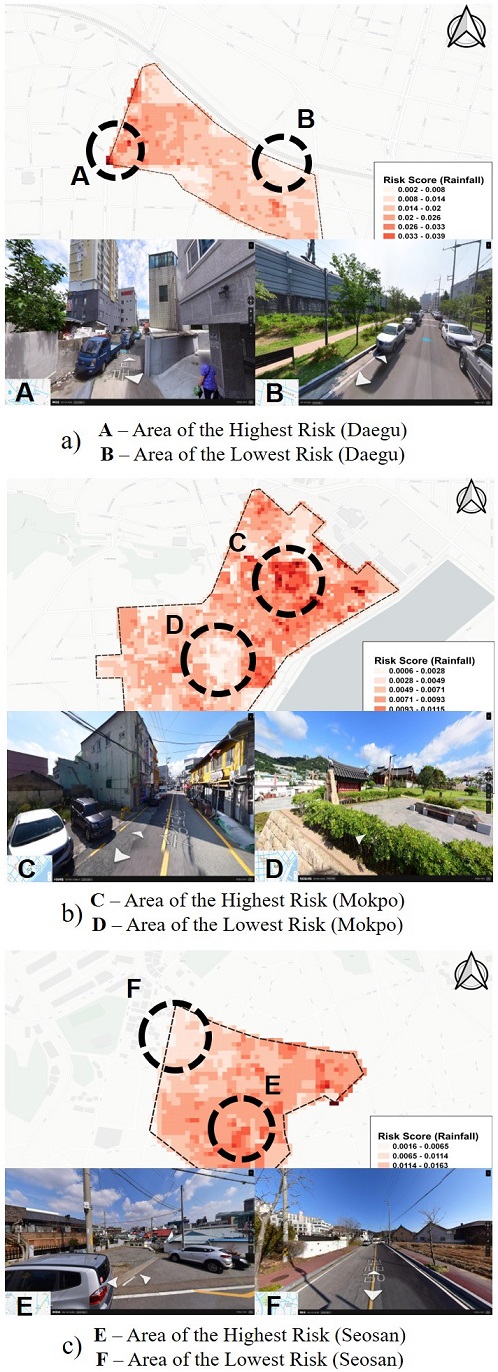
Fig. 9. shows the highest and lowest risk of heavy rainfall by each site. In Fig. 9a. and 9c., the risk of heavy rainfall is high in area A and E due to the narrow and sloping alleyways, whereas area B and F with flat land and sufficient facilities for reduction have a low risk. In Mokpo (see Fig. 9b.)), the risk of heavy rainfall is high in area C. Commercial facilities and old residential buildings with insufficient installation of water channel facility are located in area C. The park located at a high altitude (Area D) has a low risk of heavy rainfall. According to the results, it is suggested to make appropriate preparation and facility inspection for old facilities and sloping narrow ways to prepare for the heavy rain period.
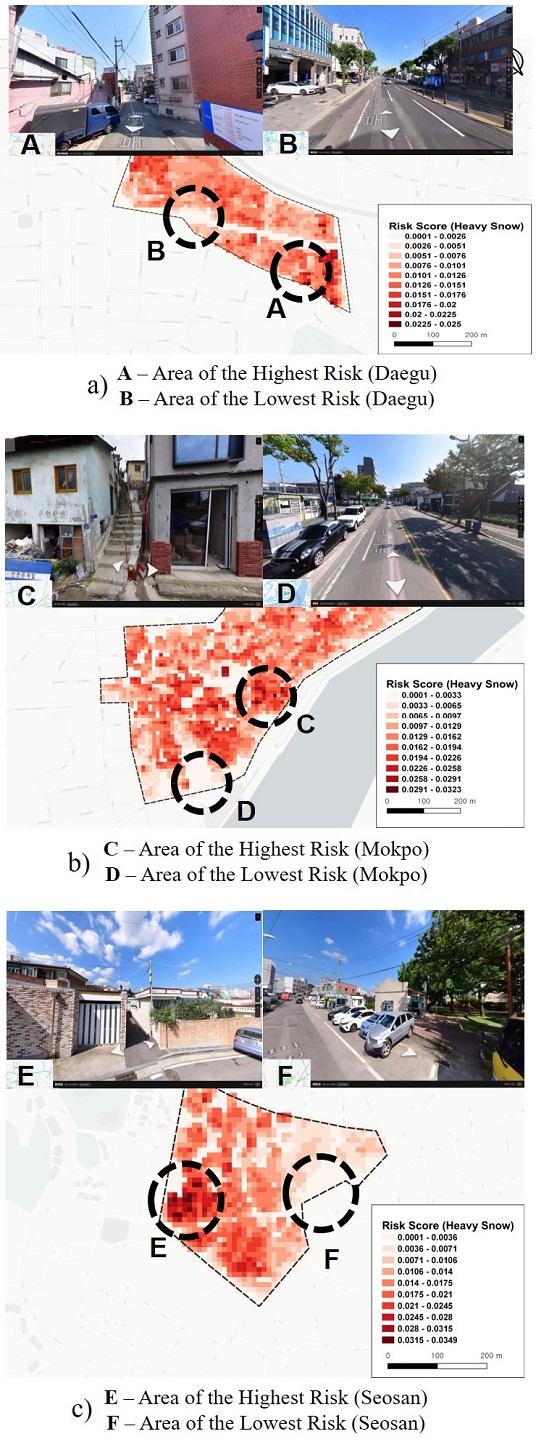
Fig. 10. shows the highest and lowest of heavy snow in three sites. Area A, C and E where steep slopes and old facilities exist show high risk of heavy snow. However, area B, D and F with a wide road and large amounts of reduction facilities (snow removal tools) have the low risk of heavy snow. To prepare for the heavy snow, it is suggested to make appropriate arrangement of reduction facilities, such as Calcium Chloride, snow removal tools etc. in high risk area.
As a result, these findings demonstrate the disaster risk for specific declining areas in a city. Moreover, this study shows that disaster risk can be different in small areas and is relatively comparable.
5. Discussion
In this study, we calculate risk assessment scores of heavy rainfall and snow in small declining areas by applying weights of risk indicators. According to the results, this study shows that the risk of heavy rainfall and snow disasters can differ even in a small declining area. Additionally, risk is higher in vulnerable facilities and deteriorated buildings. Given the results of the study, the risk assessment score can be useful to establish the strategy for regeneration projects and disaster preparation. We identified small areas that need appropriate strategies in narrow alleys and steep slopes, such as reduction facilities.
The developed model can solve the limitations of previous studies. 1) This model specializes in a small declining areas. Unlike previous studies that focused on the analysis at the macroscale level (ex. Si, Gun and Gu), this study can be used to analyze microscale levels. 2) This model enables risk assessment with the types of disasters and region-specific analysis by applying weights for each indicator.
6. Conclusion
This paper establishes a risk assessment model for heavy rainfall and snow disasters in a small declining area in a city by using the AHP weight of disaster risk indicators. After selecting indicators for each risk assessment factor in the range of a 1 m grid, the scores were classified into a grid in the range of a 10 m grid. A model for evaluating the risk of disasters in declining areas was proposed from a microscopic perspective rather than a macroscopic analysis. Consequently, the risk assessment result for a small area was evaluated with a numerical score multiplied by weight and visualized on a 10 m grid. The results of this paper are applicable to establishing regeneration projects in declining cities that are vulnerable to disasters.
The results of this study can be used to improve further research. The integrated results of the risk assessment score in a 10 m grid with the AHP weight of risk indicators can be expanded to various kinds of disasters. Moreover, a risk assessment model applying weight by regional disaster type is necessary to focus on the various regions and disasters.
Acknowledgments
This research was supported by a grant (21TSRD-B151228-03) from Urban Declining Area Regenerative Capacity-Enhancing Technology Research Program funded by Ministry of Land, Infrastructure and Transport of Korean government.
References
-
P. Petsimeris, Urban decline and the new social and ethnic divisions in the core cities of the Italian industrial triangle. Urban Studies, 35(3), 1998, pp.449-466.
[https://doi.org/10.1080/0042098984853]

- A. Kunath, Impacts Of Social Change On Disaster Risk Management In Shrinking Cities - Multidisciplinary perspectives on urban resilience, Basque centre for Climate Change (BC3), 2012, pp.27-33.
-
C. B. Field et al., Summary for policymakers In: Climate Change 2014: Impacts, Adaptation, and Vulnerability. PartA: Global and Sectoral Aspects. Contribution of Working Group II to the Fifth Assessment Report of the Intergovernmental Panel on Climate Change, IPCC, 2014, pp.1–32.
[https://doi.org/10.1017/CBO9781107415379.003]

-
박재혁 외 3인, 지역의 재난 취약성 평가방법의 제안과 호우 재난에 적용. 한국방재학회논문집, 제20권 제1호, 2020, pp.151-161.
J.H. Park et al., An Assessment Method for Evaluating Vulnerability to Regional Disasters and Its Application to Disaster due to Heavy Rain. Journal of the Korean Society of Hazard Mitigation, 20(1), 2020, pp.151-161. [https://doi.org/10.9798/KOSHAM.2020.20.1.151]
-
C.W. Park et al., Development of a Risk Assessment Model of Rainfall for Small Area in Declining Urban Areas. KIEAE Journal, 20(6), 2020, pp.7-12.
[https://doi.org/10.12813/kieae.2020.20.6.007]

- OECD, Managing urban change. Policies and Finance. Vol. I. (Paris: OECD), 1983, pp.149-152.
-
P. C. Cheshire, D. G. Hay, Urban Problems in Western Europe: An economic analysis. Routledge, 2017, pp.45-50.
[https://doi.org/10.4324/9781315100203]

-
Y. J. Wang et al., Spatio-temporal changes of exposure and vulnerability to floods in China. Advances in Climate Change Research, 5(4), 2014, pp.197-205.
[https://doi.org/10.1016/j.accre.2015.03.002]

-
H. Visser, A. C. Petersen, W. Ligtvoet, On the relation between weather-related disaster impacts, vulnerability and climate change. Climatic Change. 125(3), 2014, pp.461-477.
[https://doi.org/10.1007/s10584-014-1179-z]

-
국토교통부, 도시 기후변화 재해취약성분석 및 활용에 관한 지침, 국토교통부 훈령 제956호.
Ministry of Land, Infrastructure and Transport, Guidelines on the Analysis and Utilization of Urban Climate Change Disaster Vulnerabilities, Koream MOLIT, 956, 2018. -
이병재, 김학열, 김소윤, 기후변화 홍수에 대한 국토 취약성 변화 분석 연구. 한국방재학회논문집, 제18권 제6호, 2018, pp.27–33.
B.J. Lee, H.Y. Kim, S.Y. Kim, Changes in Climate Change Flood Vulnerability for National Territories. The Journal of the Korean Society of Hazard Mitigation, 18(6), 2018, pp.27–33. [https://doi.org/10.9798/KOSHAM.2018.18.6.27]
-
김지영 외 3인, 쇠퇴지역과 도시지역의 재난 취약요인 비교· 분석. 한국디지털콘텐츠학회 논문지, 제21권 제11호, 2020, pp.2021-2032.
J.Y. Kim et al., A Comparative Analysis of Disaster Vulnerability Factors between Declining Areas and Urban Areas. Journal of Digital Contents Society, 21(11), 2020, pp.2021-2032. [https://doi.org/10.9728/dcs.2020.21.11.2021]
-
윤상훈, 박근오, 김근영, 대설특성을 통한 잠재적 위험도 분석 - 충청북도 11개 시·군을 중심으로, 한국재난정보학회, 제11권 제1호, 2015, pp.23-34.
S.H. Yoon, K.O. Park, G.Y. Kim, An Analysis of Potential Danger Factors by the Characteristics of Heavy Snow-Focused 11 Cities and Guns in Chungcheongbuk-do. Journal of the Society of Disaster Information, 11(1), 2015, pp.23-34. [https://doi.org/10.15683/kosdi.2015.11.1.23]
-
원주성, 민병학, 김세용, 기후변화 취약성을 고려한 쇠퇴도시 진단지표 산정 개선 연구-폭염재해 취약성을 중심으로. 한국생태환경건축학회 논문집, 제20권 제6호, 2020, pp.147-158.
J.S. Won, B.H. Min, S.Y. Kim, The Improvement of Diagnostic Indicators for Decline Cities Considering the Vulnerabilities in Climate Change -Focusing on the Vulnerability of Heat Wave Disasters -, KIEAE Journal, 20(6), 2020, pp.147-158. [https://doi.org/10.12813/kieae.2020.20.6.147]
-
장용일, 김창성, 녹색 커뮤니티 관점에서 GIS 기법을 활용한 제주시 도시지역의 도시재생 방향 제시, 한국생태환경건축학회 논문집, 제19권 제4호, 2019, pp.35-44.
Y.I. Jang, C.S. Kim, A Proposal for Urban Regeneration Direction In the Urban Area of Jeju City by using GIS Technique from theperspective of green community, KIEAE Journal, 19(4), 2019, pp.35-44. [https://doi.org/10.12813/kieae.2019.19.4.035]
-
박강아, 김종구, 박민아, 항만배후 주거지역의 안전 취약성을 고려한 도시재생: 부산광역시 동구와 남구를 대상으로.. 대한토목학회논문집, 제38권 제5호, 2018, pp.761-769.
K.A. Park, J.G. Kim, M.A. Park, Urban Regeneration Considerated on Safety Vulnerability of Port Hinterland Residential Area - Focused on Dong-Gu and Nam-Gu of BusanMetropolitan City. Journal of the Korean Society of Civil Engineers, 38(5), 2018, pp.761-769. -
유선철, 여관현, 기후변화에 대응한 도시재생 지표개발 및 활성화지역 선정 연구: 서울특별시 사례를 중심으로. 도시행정학보, 제28권 제4호, 2015, pp.77-99.
S.C. You, K.H. Yeo, A Study on the Development of Indicators and Activate about Urban Regeneration Corresponding Climate Change: Focusing on the Seoul Metropolitan City. Journal of the Korean Urban Management Association, 28(4), 2015, pp.77-99. - Urban Regeneration Information System, https://www.city.go.kr/portal/business/newDeal/statusInfo/link.do, , 2020.12.20.
- Korea Meteorological Administration, https://data.kma.go.kr/data/, , 2020.07.12.
- National Geographic Information Institute, https://www.ngii.go.kr, , 2020.01.04.
- Environmental Geographic Information Service, http://egis.me.go.kr, , 2020.04.10.
- National Spatial Data Infrastructure Portal, http://www.nsdi.go.kr/lxportal/?menuno=2679, , 2020.04.20.
- Ministry of Environment Sewerage System Statistics, http://www.me.go.kr/home/web/policy_data/read.do?menuId=10264&seq=7146, , 2020.01.20.
- Open Data Portal, data.go.kr, 2020.04.10.
-
이경수 외 3인, 델파이기법과 AHP 를 이용한 대전시의 도시재난 위험요소 선정에 관한 연구. 한국위기관리논집, 제11권 제4호, 2015, pp.69-84.
K.S. Lee et al., A study on selection of the risk factors for urban disaster of Daejeon metropolitan city using Delphi and AHP. Crisis and Emergency Management: Theory and Praxis, 11(4), 2015, pp.69-84.
