
An Analytical Framework for Evaluating Workplace Walkability in Business Districts
ⓒ 2026. KIEAE all rights reserved.
Abstract
This study presents an analytical framework for evaluating workplace walkability in business districts from two functional perspectives: commuting and restoration. By distinguishing commute-related walking from restorative walking and translating their environmental requirements into measurable indicators, the study seeks to provide a framework for systematically assessing walking environments around workplaces and comparing offices on a common basis.
Everyday walking among office workers was classified into commute-related walking and restorative walking, and two corresponding indicator sets were defined. Commute walkability indicators correspond to the mobility and accessibility dimension, whereas restorative walkability indicators correspond to everyday destination and restorative environment dimensions. Using road and sidewalk data, network-based walkable service areas were constructed around each office, and spatial data within these areas were used to compute standardized walkability indices.
The proposed framework generated standardized commute and restorative walkability indices and enabled systematic comparison of workplaces within business districts. Application to a central business district (CBD) demonstrated that the proposed analytic framework can capture variation in workplace walkability across offices, indicating that the framework can be used to diagnose commute- and restoration-related weaknesses in workplace walking environments and to identify offices where walking-environment improvements should be prioritized.
Keywords:
Workplace Walkability, Business District, Commute-Related Walking, Restorative Walking1. Introduction
Walking is one of the most fundamental forms of physical activity and it plays a crucial role in reducing the risk of chronic diseases while improving overall physical and mental health [1~3]. Recently, walking has been increasingly recognized as an essential component of sustainable cities and healthy living environments, which has led to growing interest in urban environments that encourage walking [4,5,19,20]. In urban planning and public health research, built environment has been treated as a major environmental factor that promotes and supports physical activity [4~7].
A concept used to explain the relationship between environment and walking behavior is walkability. Walkability can be understood as a spatial attribute indicating how easily and conveniently people can walk in everyday life [8~10,21,29]. Previous studies have reported that walkability is closely associated not only with physical activity levels but also with health, quality of life, and regional sustainability [8~12,19]. Based on these findings, a wide range of walkability assessment methods and spatial analytical approaches have been developed [9,22,23,30,31]. Such research has provided theoretical and practical foundations for quantitatively evaluating urban environments and developing health-supportive cities.
To date, most walkability research has focused on residential districts [8~12,27~32]. However, in modern cities, adults spend a substantial portion of their day at their workplaces and in surrounding areas, and a considerable share of everyday walking also occurs within business districts [13~17]. The environment around workplaces can serve as an important spatial condition supporting workers’ physical activity, health, and well-being [13~18,24~26]. Although recent studies have increasingly examined the relationship between workplace environments and walking behavior, walkability research targeting business districts remains limited compared to residential studies, and evaluation frameworks that adequately reflect workplace characteristics are still underdeveloped [14~17].
Walking in workplace settings differs from everyday walking in residential neighborhoods in terms of purpose and context. In business districts, active commuting and restorative walking during lunch or short breaks are representative forms of walking [13~18,24~26]. While previous work has pointed the need to evaluate walkability by trip purpose, there is still a lack of analyses that consider commute-related walking and restorative walking as distinct functional purposes within workplace environments [22]. Active commuting is likely to be strongly influenced by transit accessibility and pedestrian infrastructure, whereas restorative walking depends more on everyday destinations and green or open spaces that support rest and recovery [6,7,18]. Accordingly, evaluating walkability in workplace settings requires an approach that goes beyond a single, undifferentiated concept and instead reflects these different purposes and functional characteristics.
In this context, this study proposes an analytical framework for assessing workplace walkability in business districts from two perspectives: commute walkability and restorative walkability. Using this framework, workplace walkability can be quantitatively compared across offices, and the walking environment around workplaces could be evaluated in functional terms according to commute-related and restorative walking purposes. Furthermore, by providing a basis for systematically diagnosing walking environments in business districts, this study aims to support future efforts to create walkable workplace environments and to inform related policy making as well as urban, architectural, and interior design decisions.
2. Literature Review
2.1. Environment, Physical Activity, and Walkability
Studies on chronic diseases and mental health consistently show that regular physical activity reduces the incidence and mortality of major non-communicable diseases and improves overall health and well-being [1~3]. Bull et al. reported that achieving recommended activity levels is associated with lower risks of chronic diseases [1], while Lee et al. and Warburton et al. demonstrated that insufficient physical activity contributes substantially to global burdens of obesity, hypertension, depression, and other chronic conditions [2,3]. These findings underscore that physical activity is a critical determinant of population health.
Building on this evidence, studies have examined how urban environments shape physical activity. Frank et al. discussed systematic links between land use and health mediated by environmental pathways [8], and Sallis et al. reported that built environment attributes sare closely related to physical activity and obesity indicators, indicating that the amount and type of physical activity people engage in are influenced not only by personal preferences but also by the physical and spatial environments in which they live [4,19].
Within this line of work, walkability has become a core concept linking environment, walking, and health. Frank et al. developed a walkability index that integrates land-use mix. street connectivity, and density, providing an analytical framework that quantitatively connects built environment characteristics with walking and activity levels [8,9]. Ewing and Handy organized urban design features related to walking, arguing that street continuity, legibility, human scale, and visual interest exert important influences on walking and perceived environmental quality [21]. Taken together, these studies repeatedly report that urban environmental attributes are closely related to walking and physical activity, and that creating walkable built environments is proposed as a planning strategy that can simultaneously support health and sustainability [4~11,19~21].
2.2. Walking in Everyday Work Settings
Studies indicate that built environments near workplaces can influence workers’ physical activity and sedentary behavior. Lin et al. reported that workplace neighborhood environments are significantly associated with commuting and activity levels during work [17,26], and Barr et al. examined walking opportunities and commuting walks across residential, workplace, arguing that workplace accessibility and walking environments should be treated as independent units of analysis [13].
Several studies distinguish workplace-related walking into two types: commute-related walking, which occurs during journeys to and from work, and restorative walking, which takes place during lunch breaks or short rest periods. Both types contribute to workers’ daily physical activity and well-being, yet they differ in function and environmental requirements [18,24,25]. Brown et al. analyzed commute-related walking separately from short walking breaks during work and showed that commute-related walking is primarily linked to metabolic and cardiovascular risk and overall activity levels, whereas brief walking breaks are more directly associated with stress, fatigue, mood, and performance –related outcomes [24]. Studies by Roe and Aspinall and Thøgersen‑Ntoumani et al. likewise report that lunchtime and break-time walking in natural and pleasant environments supports emotional recovery and work-related performance, providing further evidence for distinguishing workplace walking into commute and restorative types [18,25].
Numerous studies report that active commuters who walk or cycle to work have better physical health, lower obesity levels, reduced cardiovascular risk, and lower mortality than commuters who rely solely on cars. Bauman et al. summarized evidence showing that commuting mode and physical activity during commuting make important contributions to adults’ total activity levels and health outcomes, and the WHO 2020 physical activity guidelines emphasize that walking and cycling for commuting and everyday travel are central to preventing chronic disease and promoting mental health [1,3,18]. Barr et al. found that achieving a certain amount of walking during commuting is related to accessibility at residential, workplace, and regional scales, and treated commute-related walking as a major component of workers’ daily physical activity [13].
Commute time and mode are also related to subjective well-being, stress, and satisfaction with work and leisure. Studies indicate that when commuting includes a certain level of walking, mental health and everyday satisfaction tend to be reported more positively. Young et al. argued that walking and cycling during commuting can reduce metabolic and cardiovascular risk and may also have favorable effects on everyday stress and life satisfaction [20].
The occurrence of commute-related walking is shaped not only by individual motivation but also by commute routes and the walkability of the workplace surroundings. Adams et al. used the concept of workplace neighborhood and showed that commute-related walking is reported more frequently in workplace areas perceived as highly walkable, safe, and pleasant [16]. Lin et al. demonstrated, among office workers, transport and pedestrian infrastructure as well as land-use structures around workplaces are associated with commute- related walking and sedentary time [17,26], while Barr et al. reported that active commuting is more prevalent where basic pedestrian infrastructure is in place [13,15].
Intervention and panel studies consistently indicate that walking around workplaces during lunch breaks and short rest periods has restorative functions. Brown et al. suggested that lunchtime walking around the workplace can help reduce stress, improve mood, and mitigate post-work fatigue [24], and Roe and Aspinall showed that walking in natural environments reduces tension and negative affect and enhances feelings of mental restoration [18].
Walking in parks or outdoor spaces during lunchtime has been reported to reduce tension, fatigue, and negative affect in afternoon work hours, while enhancing concentration, and self-rated work performance. Thøgersen-Ntoumani et al. observed that on days when employees participated in workplace walking programs that included lunchtime walking, work-related stress was relieved and self-rated mood and performance improved [25]. These findings indicate that short walks and lunchtime walking around workplaces function not merely as energy expenditure, but as a type of walking that supports psychological, emotional, and cognitive recovery during and after work [18,24,25].
Studies also offer common insights into environmental conditions that enable restorative walking. Adams et al. reported that when everyday destinations and small green spaces are located within walking distance around workplaces, employees are more likely to go outside to walk during lunch and breaks [16]. Barr et al. and Lin et al. noted that whether walking routes to such destinations and restorative spaces are safe and pleasant is related to the actual occurrence of restorative walking, showing that pedestrian infrastructure and land-use structures around workplaces form an important background for workers’ opportunities to engage in restorative walking [13,17,26].
2.3. Walkability Indicators
Indicator systems for quantitatively evaluating walkability have been proposed in various studies to operationalize the assessment of pedestrian environments (Table 1.). Walkablity indicator systems primarily evolved around urban form measures such as land-use mix, density, and street connectivity. Studies by Frank et al., Ewing and Handy, and Lee and Moudon combined land-use mix, density, street connectivity, and streetscape characteristics at residential and street scales to develop walkability indices that explain everyday walking, mode choice, and perceived environmental quality [8,9,21,27].

Walkability indicators in previous studies
Subsequent work by Sallis et al., Hall and Ram, and Forsyth incorporated indicators such as everyday destinations, transit accessibility, park/green-space access, safety/comfort, and destination density, extending walkability indicator frameworks to capture destination structures as well as safety and pleasantness [19,23,29]. Knapskog et al. and Lam et al. proposed indicator sets for neighborhood and national scales that encompass infrastructure and transport, urbanity, activities and destinations, density and mixed uses, network structure, and transit accessibility [30,31].
Similar axes of indicators also appear in policy documents and domestic studies. The American Heart Association’s policy statement by Young et al. identifies walking infrastructure, safety and complete streets, transit connectivity, and mixed land use as core elements of walkable built environments [20]. Park et al. and the Architecture & Urban Research Institute (AURI) developed walkability indicators tailored to the Korean urban context, including street connectivity, land-use mix and everyday destinations, pedestrian infrastructure and safety, street quality, transit accessibility [32,33].
3. Methods
3.1. Walkability Indicator Composition
Based on the reviewed literature, this study distinguishes workers’ everyday walking into two types: commute-related walking and restorative walking. Recognizing that these two types are supported by different environmental affordances, workplace walkability indicators are organized into two sets: commute walkability indicators and restorative walkability indicators. Commute walkability indicators correspond to the mobility and accessibility dimension, including transit accessibility, and pedestrian infrastructure, whereas restorative walkability indicators correspond to destination and restorative environment dimensions, including everyday destinations and green/open spaces (Table 2.).
Walkability indicators
Commute walkability indicators are defined as a set of environmental variables that support walking related to commuting trips. To capture transit accessibility, the number of nearby subway stations and the distance from each office to the nearest station are used as indicators, along with the number of bus stops and the distance to the nearest stop. In addition, the number of public bike-sharing stations (Seoul Bike) in the surrounding area and the distance from the office to the nearest station are included to capture opportunities for choosing active transport during commuting. Sidewalk ratio is used as a pedestrian infrastructure indicator reflecting the level of walking infrastructure and safety.
Restorative walkability indicators are defined as a set of environmental variables that support walking for psychological and physical restoration during lunch breaks or short walks. Everyday destination indicator including the number of restaurants, convenience stores, and cafés around each office reflects everyday purposes and convenience. Green-space and open-space indicators include green space area and distance to the nearest green space, as well as open space area and distance to the nearest open space, representing restorative environments. Sidewalk ratio is also included in the restorative indicator set to reflect the common influence of pedestrian infrastructure on restorative walking.
3.2. Network-Based Service Areas
To consistently evaluate the walking environment around workplaces for each office, a pedestrian network comprising walkable streets and sidewalks was constructed, and service areas were defined based on this network (Fig. 1.). First, road and sidewalk data were used to build a network of walkable links, and the centroid of each office were mapped as a starting node of the network (Fig. 1. a)). Network analysis was then conducted to extract all walkable links reachable within 400m (one-way) from each office to obtain a 400m walkable network around each workplace (Fig. 1. b)). By generating polygons that enclose these links, network-based service area boundaries were derived to spatially represent the configuration of walkable routes reachable within 400m (Fig. 1. c)), and these polygons were defined as service areas for each office (Fig. 1. d)).
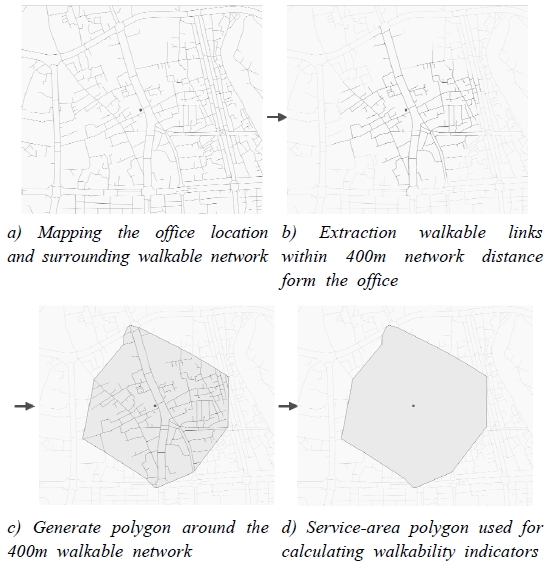
Steps for constructing network-based service areas
While generating polygons that enclose the 400m walkable networks around offices, this study adopted a concave hull approach and selected a parameter representing a moderate level of concaveness rather than using the default value (e.g., alpha≈0.3) commonly implemented in GIS software. Previous research has reported that the degree of concaveness in concave hulls should be adjusted to match the geometric characteristics of the data and the analytical purpose [34]. Accordingly, rather than fixing the alpha value in advance, several candidate values were compared. Polygons were experimentally generated by varying alpha from 0.1 to 0.9 in increments of 0.1, and the results showed that an alpha value of 0.6 produced service areas that represented the configuration of the extracted walkable network without covering excessively wide surrounding areas. Based on this experimental assessment, alpha=0.6 was adopted as the concaveness level most suitable for the purpose of workplace walkability analysis.
Previous studies have defined service areas by simple Euclidean buffers with fixed radii from a central point [30,31]. Such circular buffers, however, do not adequately reflect actual walkable routes or physical barriers such as major roads, rivers, and fragmented block structures. In contrast, the network-based service areas used in this study are derived from walkable links reachable along the pedestrian network and therefore reflect route configuration and physical barriers more directly than simple circular buffers. A 400m network distance corresponds to approximately a five-minute walk at typical urban walking speeds and can be interpreted as a reasonable everyday walking range for accessing transit stops during commuting and for lunchtime or short walks [28]. Therefore, each office’s 400m network service area is used as the basic spatial unit for evaluating workplace walkability.
3.3. Walkability Analysis
The walkability analysis in this study was conducted using individual offices as the basic units of analysis. For each office, a 400m network-based walkable service area was defined, and the locations of amenities, transit stops, green spaces, and open spaces within this service area were overlaid to compute commute and restorative walkability indices (Fig. 2.).
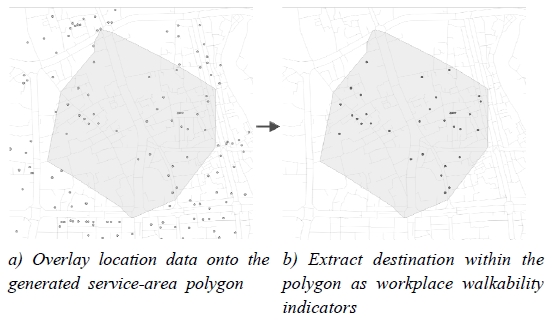
Steps for computing workplace walkability indicators
To compare relative walkability across offices, environmental indicators constituting commute and restorative walkability were standardized and converted into composite indices. For each office, distance indicators (distance to subway stations, bus stops, bike-sharing stations, green spaces, and open spaces) and count indicators (number of subway stations, bus stops, bike-sharing stations, everyday destinations) were first calculated and then standardized into z-scores with mean 0 and standard deviation 1. For distance indicators, signs were reversed to reflect the fact that smaller values indicate higher accessibility, so that larger standardized values can be interpreted as better accessibility. Commute walkability index was then defined as the equally weighted average of z-scores for transit and bike-sharing accessibility and pedestrian infrastructure, while restorative walkability index was defined as the average of z-scores for everyday destinations and green/open spaces.
This z-score-based averaging approach reduces scale differences among variables and allows each office’s walkability level to be interpreted in terms of its relative position within the distribution of workplaces in the business district. Existing walkability index studies standardize component indicators such as density, connectivity, transit access, and park access as z-scores, and then derive composite indices by summing or averaging these standardized values [8,9,19]. This study extends such approaches to the workplace context by constructing commute and restorative walkability indices at the office level.
4. Results
4.1. Workplace Walkability Analytical Framework
This study developed an office-level workplace walkability analytical framework that evaluates walking environments around workplaces from two perspectives: Commute walkability and restorative walkability. The proposed framework uses offices as units of analysis and follows a two-step procedure that defines a 400m network-based service area for each office, extracts and standardizes spatial information within this area, and computes commute and restorative walkability indices (Fig. 3.).
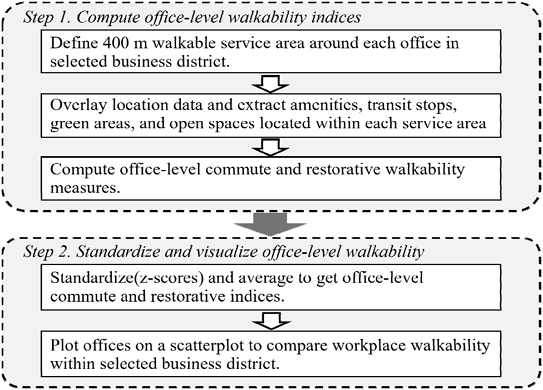
Workplace walkability analysis procedure
In Step 1, commute and restorative walkability indicators are calculated for each office. The centroid of each office building is first set as a starting point on the pedestrian network, and a 400m walkable service area is defined based on links reachable within 400m one way. Location data for amenities, transit stops, public bike-sharing stations, green spaces, and open spaces are then overlaid on this service area, and everyday destinations and walking-related infrastructure included within the service-area polygon are aggregated. At this stage, commute walkability indicators—such as the number of subway stations, bus stops, and bike-sharing stations and the shortest distances to these, as well as sidewalk ratio—are computed for each office, along with restorative walkability indicators—such as the number of everyday destinations and the areas and shortest distances of green and open spaces. This step quantitatively captures, at the office level, the levels of commute and restorative destinations and walking infrastructure represented within the network-based service area.
In Step 2, the derived indicators are standardized and aggregated into office-level walkability indices, which are then visualized. Distance and count indicators for each office are converted into z-scores with mean 0 and standard deviation 1 to adjust scale differences among variables. Signs of distance indicators are reversed so that higher standardized values indicate better accessibility. The commute walkability index for each office is defined as the average of z-scores for transit and bike-sharing accessibility and pedestrian infrastructure, and the restorative walkability index is defined as the average of z-scores for everyday destinations and green/open spaces. Finally, offices are plotted on a scatterplot using these two indices as axes, with each office represented by a point showing its commute and restorative walkability levels, enabling visual comparison of the relative distribution of workplace walkability within the business district.
In this analytical framework, commute walkability represents environmental opportunities for active commuting to workplaces based on transit accessibility and pedestrian infrastructure, whereas restorative walkability represents environmental opportunities for restorative walking during lunch breaks or rest periods based on everyday destinations and green/open spaces. Because the two indices are computed independently using the same network-based service area and analytical procedure, commute-related and restorative walking environments can be separately evaluated even for the same office. This makes it possible to distinguish functional characteristics of walking environments around workplaces—such as commute-oriented, restorative-oriented, or balanced offices—that are difficult to capture with a single walkability metric.
4.2. Application: CBD (Central Business District)
To examine the applicability of the proposed workplace walkability analytical framework, the Central Business District (CBD) in Seoul was selected (Fig. 4.). The study area includes Sajik-dong, Jongno 1·2·3·4-ga-dong, Jongno 5·6-ga-dong, Changsin 1-dong, and Sungin 2-dong in Jongno-gu, and Sogong-dong, Myeong-dong, Gwanghui-dong, Euljiro-dong, Hwanghak-dong, and Sindang-dong in Jung-gu. All facilities registered for office use within this area and operating as of February 2026 were included. Commute and restorative walkability indicators were computed for all 279 offices in the study area, and each indicator was standardized into z-scores to derive office-level commute and restorative walkability indices. These indices indicate, for each office, the level of commute-related and restorative walking environments relative to the overall distribution, and were used to compare and analyze differences in walking environments around workplaces at the office level. Descriptive statistics for the two indices are presented in Table 3.
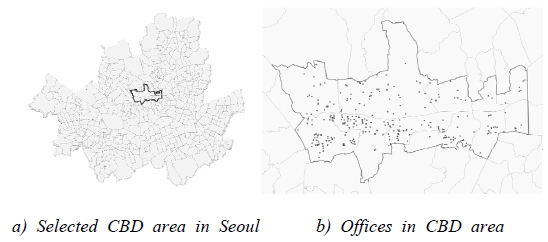
Selected offices in Seoul CBD
Descriptive statistics of workplace walkability indices in the Seoul CBD(n=279)
Commute and restorative walkability indices for the 279 offices were plotted on a scatterplot (Fig. 5.). The original indices showed a positive correlation (𝑟=0.305, 95% CI [0.195,0.408], 𝑝<0.001). However, because sidewalk ratio was included in both the commute and restorative walkability indices, this association may partly reflect the influence of the shared pedestrian-infrastructure component. To examine this possibility, a sensitivity analysis was conducted after excluding sidewalk ratio from both indices. The correlation between the revised indices was not statistically significant (𝑟=0.019, 95% CI [-0.098,0.136], 𝑝=0.748), suggesting that the positive association observed in the original indices was influenced by the shared sidewalk-ratio component.
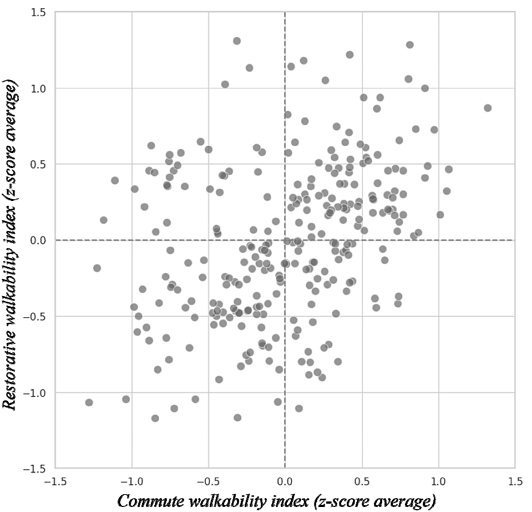
Workplace walkability distribution of offices in the CBDNote: To improve the readability of the central distribution, the x-axis range was restricted; one observation with a commute walkability index below −1.5 is not displayed
The analysis revealed variation in workplace walkability across offices within the same business district, with offices showing different combinations of commute and restorative walkability. This variation indicates that workplace walking environments cannot be fully characterized by a single walkability score. Instead, the proposed framework enables office-level walking environments to be examined separately in relation to commuting and restorative functions. By applying a consistent set of indicators and analytical procedures, the framework also provides a basis for comparing workplace walkability across offices within and across business districts.
5. Discussion and Conclusion
This study proposed an analytical framework for evaluating workplace walkability in business districts from two functional perspectives: commute walkability and restorative walkability. While existing walkability research has primarily focused on relationships between residential environments, physical activity, and health, this study extends that research stream to workplace settings by presenting an office-based analytical framework for systematically comparing and evaluating walking environments around workplaces. In doing so, it positions workplace surroundings as an important component of the broader discourse on the connections between environment, physical activity, and health and provides a basis for assessing walking environments from a workplace perspective.
Rather than treating workplace walkability as a single concept, this study distinguishes commute and restorative walkability and analyzes them separately. Walking in workplace settings includes diverse purposes and contexts, such as active commuting during journeys to and from work and restorative walking during lunch and breaks, each of which may require different spatial conditions. By reflecting these functional differences, the proposed framework enables more detailed evaluation of which types of walking are supported by the environment around workplaces. This suggests that walking environments around workplaces should be interpreted not as having a single level of walkability, but as multifunctional spaces that support different forms of walking.
The CBD case application demonstrated that the proposed analytical framework can capture differences in workplace walkability across offices within a single business district. By plotting commute and restorative walkability indices for 279 offices in the CBD, the framework identified offices that are favorable for active commuting, offices that are more supportive of restorative walking, and offices where both functions are relatively weak. These results indicate that workplace walking environments in a business district are structured along distinct functional dimensions, suggesting that broad district-level assessments need to be complemented by office-level analysis in order to capture meaningful variations in commute and restorative walkability.
At the same time, this study has several limitations stemming from its focus on physical environmental indicators. The proposed indices reflect objective spatial characteristics such as transit accessibility, pedestrian infrastructure, everyday destinations, and green and open spaces, but do not directly incorporate actual walking behavior, commute and break-time routes, perceptions and satisfaction with the environment, or health and well-being outcomes. The commute and restorative walkability indices were also constructed by equally weighting component indicators and comparing relative environmental levels, which may not fully reflect differences in the importance of each indicator depending on workers’ commute patterns, break-time activities, and job characteristics. Consequently, the proposed framework should be understood as a spatial analysis framework for quantitatively evaluating relative workplace walkability, and further verification of its relationships with actual walking behavior is required.
In addition, the network-based service areas were delineated using concave-hull polygons enclosing pedestrian-network links reachable within 400m from each office. Although this approach provides a practical representation of the surrounding walkable network, the interior of a polygon does not necessarily coincide exactly with the area that is reachable within the 400m network-distance threshold. Some facilities located within a polygon may exceed the 400m network-distance threshold because of network discontinuities or access barriers. The polygon-based aggregation should therefore be interpreted as an approximation of the network-reachable walking environment.
Future research should apply the analytical framework to diverse cities and business districts to compare workplace walkability across regions. Studies that combine empirical data on actual walking, commute mode choice, lunchtime and break-time walking behavior, spatial perceptions and satisfaction, and health and well-being measures are also needed to more comprehensively test relationships between workplace walkability and workers’ physical activity and health. Furthermore, research that estimates the relative impacts of transit accessibility, pedestrian infrastructure, everyday destinations, and green and open spaces on physical activity and restorative experiences—based on actual walking behavior and information on job type and work patterns—and uses these estimates to set indicator weights would help refine the indices. Such work would enhance understanding of workplace walking environments not merely as spaces for movement but as health-supportive environments that jointly facilitate everyday physical activity and restoration, and ultimately provide practical evidence for designing walkable business districts and workplaces and for informing policy, planning, and design decisions.
Acknowledgments
This work was supported by the National Research Foundation of Korea (NRF) grant funded by the Korea government (MSIT) (No. RS-2024-00345815).
References
-
F.C. Bull et al., World Health Organization 2020 guidelines on physical activity and sedentary behaviour, British Journal of Sports Medicine, 54, 2020, pp.1451-1462.
[https://doi.org/10.1136/bjsports-2020-102955]

- I.-M. Lee et al., Effect of physical inactivity on major non-communicable diseases worldwide, The Lancet, 387, 2012, pp.219-229.
-
D.E.R. Warburton, C.W. Nicol, S.S.D. Bredin, Health benefits of physical activity: The evidence, Canadian Medical Association Journal, 174(6), 2006, pp.801-809.
[https://doi.org/10.1503/cmaj.051351]
-
J.F. Sallis et al., Physical activity in relation to urban environments in 14 cities worldwide: A cross-sectional study, The Lancet, 387, 2016, pp.2207-2217.
[https://doi.org/10.1016/S0140-6736(15)01284-2]
-
M.J. Nieuwenhuijsen, Urban and transport planning pathways to carbon neutral, liveable and healthy cities: A review of the current evidence, Environment International, 140, 2020, 105661.
[https://doi.org/10.1016/j.envint.2020.105661]
-
J. Maas et al., Green space, urbanity, and health: How strong is the relation?, Journal of Epidemiology and Community Health, 60, 2006, pp.587-592.
[https://doi.org/10.1136/jech.2005.043125]
-
T. Sugiyama et al., Associations of neighbourhood greenness with physical and mental health: Do walking, social coherence and local social interaction explain the relationships?, Journal of Epidemiology and Community Health, 62, 2008, e9.
[https://doi.org/10.1136/jech.2007.064287]
-
L.D. Frank et al., Many pathways from land use to health: Associations between neighborhood walkability and active transportation, body mass index, and air quality, Journal of the American Planning Association, 72(1), 2006, pp.75-87.
[https://doi.org/10.1080/01944360608976725]
-
L.D. Frank et al., The development of a walkability index: Application to the neighborhood quality of life study, British Journal of Sports Medicine, 44, 2010, pp.924-933.
[https://doi.org/10.1136/bjsm.2009.058701]
-
B.E. Saelens, S.L. Handy, Built environment correlates of walking: A review, Medicine & Science in Sports & Exercise, 40(7), 2008, pp.S550-S566.
[https://doi.org/10.1249/MSS.0b013e31817c67a4]
-
G.R. McCormack, A. Shiell, In search of causality: A systematic review of the relationship between the built environment and physical activity among adults, International Journal of Behavioral Nutrition and Physical Activity, 8, 2011, 125.
[https://doi.org/10.1186/1479-5868-8-125]
-
K.S. Conway, A.K. Menclova, Walkability and mental health resiliency during the COVID-19 pandemic, Health Economics, 34, 2025, pp.1921-1942.
[https://doi.org/10.1002/hec.70013]
-
A. Barr et al., Daily walking among commuters: A cross-sectional study of associations with residential, work, and regional accessibility in Melbourne, Australia, Environmental Health Perspectives, 127(9), 2019, 097004.
[https://doi.org/10.1289/EHP3395]
-
A. Cantley et al., Walkability around the worksite and self-reported and accelerometer-measured physical activity among adults, Health & Place, 85, 2024, 103143.
[https://doi.org/10.1016/j.healthplace.2023.103143]
-
T. Osmënaj et al., Walking to work: The role of walkability around the workplace in a Dutch adult commuting population, SSM – Population Health, 25, 2024, 101578.
[https://doi.org/10.1016/j.ssmph.2023.101578]
-
M.A. Adams, F.C. Bull, C.E. Foster, Are perceptions of the environment in the workplace neighbourhood associated with commuter walking?, Journal of Transport & Health, 3, 2016, pp.479-484.
[https://doi.org/10.1016/j.jth.2016.01.001]
-
C.-Y. Lin et al., Workplace neighbourhood built-environment attributes and workers’ physically-active and sedentary behaviour: a systematic review, International Journal of Behavioral Nutrition and Physical Activity, 17, 2020, 148.
[https://doi.org/10.1186/s12966-020-01055-x]
-
J. Roe, P. Aspinall, The restorative benefits of walking in urban and rural settings in adults with good and poor mental health, Health & Place, 17, 2011, pp.103-113.
[https://doi.org/10.1016/j.healthplace.2010.09.003]
-
J.F. Sallis et al., Built environment, physical activity, and obesity: Findings from the international physical activity and environment network (IPEN) adult study, Annual Review of Public Health, 41, 2020, pp.119-139.
[https://doi.org/10.1146/annurev-publhealth-040218-043657]
-
D.R. Young et al., Creating built environments that expand active transportation and active living across the United States: A policy statement from the American Heart Association, Circulation, 142, 2020, pp.e167-e183.
[https://doi.org/10.1161/CIR.0000000000000878]
-
R. Ewing, S. Handy, Measuring the unmeasurable: Urban design qualities related to walkability, Journal of Urban Design, 14(1), 2009, pp.65-84.
[https://doi.org/10.1080/13574800802451155]
-
M. Habibian, A. Hosseinzadeh, Walkability index across trip purposes, Sustainable Cities and Society, 42, 2018, pp.216-225.
[https://doi.org/10.1016/j.scs.2018.07.005]
-
C.M. Hall, Y. Ram, Walk score® and its potential contribution to the study of active transport and walkability: A critical and systematic review, Transportation Research Part D: Transport and Environment, 61, 2018, pp.310-324.
[https://doi.org/10.1016/j.trd.2017.12.018]
-
D.K. Brown et al., Walks4work: Rationale and study design to investigate walking at lunchtime in the workplace setting, BMC Public Health, 12, 2012, 550.
[https://doi.org/10.1186/1471-2458-12-550]
-
C. Thøgersen-Ntoumani et al., Changes in work affect in response to lunchtime walking in previously physically inactive employees: A randomized trial, Scandinavian Journal of Medicine & Science in Sports, 25, 2015, pp.778-787.
[https://doi.org/10.1111/sms.12398]
-
C.-Y. Lin et al., Workplace neighbourhood built-environment attributes and sitting at work and for transport among Japanese desk-based workers, Scientific Reports, 12, 2022, 195.
[https://doi.org/10.1038/s41598-021-03071-8]
-
C. Lee, A.V. Moudon, The 3Ds + R: Quantifying land use and urban form correlates of walking, Transportation Research Part D: Transport and Environment, 11, 2006, pp.204-215.
[https://doi.org/10.1016/j.trd.2006.02.003]
-
M. Southworth, Designing the walkable city, Journal of Urban Planning and Development, 131(4), 2005, pp.246-257.
[https://doi.org/10.1061/(ASCE)0733-9488(2005)131:4(246)]
-
A. Forsyth, What is a walkable place? The walkability debate in urban design, Urban Design International, 20(4), 2015, pp.274-292.
[https://doi.org/10.1057/udi.2015.22]
-
M. Knapskog et al., Exploring ways of measuring walkability, Transportation Research Procedia, 41, 2019, pp.264-282.
[https://doi.org/10.1016/j.trpro.2019.09.047]
-
T.M. Lam et al., Development of an objectively measured walkability index for the Netherlands, International Journal of Behavioral Nutrition and Physical Activity, 19, 2022, 50.
[https://doi.org/10.1186/s12966-022-01270-8]
- S.-H. Park, Y.-M. Choi, H.-L. Seo, Measuring walkability in urban residential neighborhoods: Development of walkability indicators, Seoul, Korea, Journal of the Architectural Institute of Korea, 24(1), 2018, pp.161-172.
- S. Han, S. Oh, Development of a pedestrian convenience index for local governments, Architecture and Urban Research Institute, 2020, pp.31-47
- J.-S. Park, S.-J. Oh, A new concave hull algorithm and concaveness measure for n-dimensional datasets, Journal of Information Science and Engineering, 29, 2013, pp.379-392.