Study on Integrated Workflow for Designing Sustainable Tall Building : With Parametric method using Rhino Grasshopper and DIVA for Daylight Optimization
©Copyright Korea Institute of Ecological Architecture and Environment
Abstract
The Objective of this study is to explore the capabilities of an integrated modelling and simulation workflow when applied to an experiment-based research process, aimed at deriving daylight optimization strategies specific to tall buildings.
Two methods were devised to apply this workflow with the help of DIVA and Rhino/Grasshopper. The first method is a multiple variant analysis by setting up an appropriate base case and analysing its daylight and energy performance, forming the basis of comparison for subsequent cases for design variants. The second method involved setting up the base case within a site context and conducting a solar irradiation study. An architectural variables such as overhang and shading device, were then defined as inputs in the parametric definition in Grasshopper to control the selected variable.
While the first method took advantage of the speed and efficiency of the integrated workflow, the second method was derived based on the ability to directly process simulation data within the integrated, single-software platform of the proposed workflow. Through these methods, different architectural strategies were explored, both to increase daylight penetration and to reduce radiant heat gain. The focus is on methods by which this workflow can be applied to facilitate the experimental derivation of daylight optimization strategies that are specific to tall building design.
Keywords:
Sustainable Building Design, Tall Building, Integrated Workflow, Daylight Optimization, DIVA1. Introduction
With rapid urbanization, the number of tall buildings completed globally each year, has almost tripled, from 263 in 2000 to 700 in 2011.1) Given that artificial lighting accounts for 10-25 percent of the overall electric load in tall office buildings,2) one key area to explore in achieving sustainability is daylight design. Daylighting refers to a ‘dynamic lighting technology that involves consideration of heat gain, glare, variations in light availability and sunlight penetration into a building’.3) It involves a careful balance of introducing daylight without excessively increasing its possible undesirable effects.
In fact, tall buildings that have been designed to be sustainable, are often unwilling to share any operational data, making it difficult to analyse the effectiveness of their design.4)
This study seeks to propose a more efficient and effective, integrated workflow, wherein the processes of modelling and analysis are carried out within a single platform - this significantly reduces the time, effort and risk of error involved in each simulation. In particular, the focus is on the software DIVA, a daylighting and energy simulation plug-in for Rhinoceros and Grasshopper.5) This workflow was then applied to test multiple strategies and to derive specific methods to optimize daylight design in the context of tall buildings.
1.1. Objective of Study
The key objective of this study is to explore and validate the methods by which an integrated workflow, that combines modelling and simulation tools within a single platform, can facilitate the experimental derivation of daylight optimization strategies that are specific to tall building design.
1.2. Methodology
This study employed an experiment-based research process in which different daylighting strategies were modelled and analysed using Grasshopper and DIVA, for their daylight and energy performance. In particular, two key methods were formulated.
The first method involved testing multiple variants, by firstly, creating a number of design variants that differed from a base case by a single parameter, such as the introduction of an atrium. Each case was analysed quickly for its heat and light performance and the simulation results were analysed with the aim of deducing guidelines for daylight design in tall buildings.
The second method involved using simulation data as a parametric input. Unlike the previous method, where alternative cases were generated by arbitrarily altering a chosen parameter, in this method, the simulation results from an initial solar radiation study form the basis of the parametric manipulation of a chosen variable, such as the depth of overhang or size of openings.
2. Daylight in Tall Buildings
2.1. Design specificity to building height
Tall building design is less influenced by micro-climatic variations at ground level, such as vegetation and topography. Instead, it is affected by vertical external conditions that change with height. In particular, the density of surrounding buildings would vary with height, implying decreased shading and hence, increased daylight access. However, this would also affect the heat gain due to solar radiation. The effect of reflections from the roof tops of surrounding buildings should also be considered .6)
Therefore, tall buildings tend to experience reduced daylight access to lower floors and increased solar exposure at higher floors, suggesting the need for non-uniform daylighting strategies across the height of the building.
2.2. Optimization of Daylight
In this study, the goal of optimization was to maximize daylight penetration while minimizing the increase in heat gain due to this increased daylight. Achieving optimum light levels through daylighting would also imply an increase in heat gain due to solar radiation and hence, an increase in energy demand from artificial cooling. Thus, the opposing factors daylight and heat gain need to be balanced. Indeed, an adequate amount of light is necessary to be able to efficiently and safely carry out various tasks. Given the optimal illuminance for office functions range defined is 300 to 400 lux.7)
3. Integrated Workflow
3.1. Present Workflow
A number of design analysis workflows already exist to facilitate an experiment-based research process through the conversion of data from three dimensional modelling softwares into simulation engines. Such workflows often involve a number of manual steps and require multiple software platforms. Figure 1 summarizes an example of a commonly applied workflow.

Diagram illustrating example of present workflow
The geometry is first generated in a CAD modeller like Rhinoceros, before being exported as a temporary file format that is compatible with the simulation tool. This file is directly imported into the simulation tool or brought through a conversion software such as Ecotect or Green Building Studio. Material properties, climate data and simulation parameters are set, before the appropriate simulation analysis is run. The data obtained may then be visualised and processed in tools like Microsoft Excel. Any changes to the original geometry due to feedback from this simulation would then require the entire process to be repeated to test the performance of this variation.
The need for multiple programs is the key limitation of the current workflow as it increases the difficulty and time required for each simulation. Firstly, users would need knowledge on the interface and capabilities of each software and be able to manage the overall exchange of information between these programs.8) At the same time, the process can become disruptive and tedious for users interested in analysing a large number of design variants. Software interoperability can also become a source of simulation errors and loss of geometric or material data, significantly influencing the accuracy of results obtained. These issues may become a barrier to usage and may discourage designers from considering environmental metrics in the design process, particularly in the early schematic design stages.
In particular, given the growing trend towards parametric modelling, such a cumbersome workflow would be unable to keep pace with the ability to now produce many iterations of a design within a short period of time. 9)
3.2. Proposed Integrated Workflow
DIVA, stands for Design, Iterate, Validate and Adapt,10) is an environmental analysis plug-in for Rhinoceros (NURBS modeling software) and Grasshopper (parametric modeling plug-in for Rhinoceros).11)
The proposed workflow utilizes the capabilities of DIVA and Grasshopper to suggest a more effective methodology (Fig. 2). Once the geometry is generated with Rhinoceros and Grasshopper, the material properties and simulation parameters are set, with the help of the Grasshopper components described. These components allow for a direct export of these settings, along with scene geometry and sensor grids into the Radiance or EnergyPlus format, without physically leaving the Rhinoceros platform. A series of performance indicators can then be calculated, before the simulation results are automatically brought back into Rhinoceros, via false colour mappings or data lists.12)

Diagram illustrating proposed integrated workflow
Thus, the entire modelling-simulation process can be carried out within a single software platform, eliminating the issues related to software interoperability and decreasing the time and difficulty involved in obtaining environmental performance feedback. This is particularly relevant in the case of complex geometric designs that are more susceptible to simulation errors.
The integration with parametric modelling further implies that any changes to the Grasshopper definition, resulting in a change in geometry, could be immediately analysed via an automatic simulation update - the material and simulation parameters need not be reset each time. Thus, this proposed integrated workflow reduces the barriers to usage and allows designers to obtain quick performance feedback throughout the design process.
3.3. Alternate available plug-ins for environmental analysis in Rhino/Grasshopper
Essentially, DIVA allows designers to quickly and efficiently visualize the daylight and energy consequences of their design at every stage of the design process, without having to manually export the building geometry each time. Within the Rhino/ Grasshopper modelling environment itself, DIVA uses Radiance and Daysim for daylighting analysis and EnergyPlus for thermal load calculations. These simulation engines are well-established in the industry and hence, their inclusion helps to validate the credibility of the software and the accuracy of the results obtained. Yet, DIVA is not the only available environmental analysis plug-in for Rhino and Grasshopper, as highlighted in Table 1.

Alternate available plug-ins for environmental analysis in Rhino/Grasshopper
However, most of these plug-ins are limited in their simulation scope, either only focusing on daylight or thermal calculations. Hence, for an optimization study, more than one tool would be required, unlike DIVA, which allows for a broad analysis scope.
4. Daylight Optimization Methods
4.1. Method 1: Testing Multiple Variants
A multiple variant analysis involves conducting a ‘series of simulations of parametrically varying designs’, rather than looking at a single design variant at each time.16)
This method, as applied in the research, involved firstly setting up an appropriate base case and analysing its daylight and energy performance, forming the basis of comparison for subsequent cases. A set of strategies or parameters to be studied, would then be defined, based on which a number of design variants will be defined.
By implementing the proposed integrated workflow, each of these cases could be rapidly and efficiently modeled and tested for its environmental performance, without the need for extensive and repetitive steps involving multiple software exchanges. The simulation analysis could be used as quick feedback to generate further cases or to modify the ones that have been created. Ultimately, based on the results obtained, some guidelines could be deduced for optimized daylight design in tall buildings.
- Settings; Based on the site dimensions, plot ratio and height restrictions of the selected site at Marina Bay, Singapore, a base case was set-up with a square footprint of 55 by 55 meter. It had a height of 200 meter, with fifty storeys - each with a floor to floor height of four meter.
The environmental performance of the base case was tested using DIVA for Grasshopper. Daylighting performance was measured in terms of illuminance levels at three different heights within the space. On the other hand, heat gain or energy performance was measured in terms of the building's average monthly cooling energy consumption. The material properties and simulation parameters used for the two types of simulations are summarized in the subsequent tables and figures.
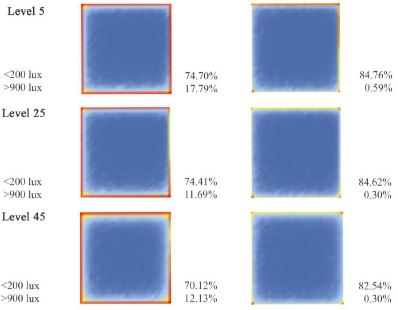
- Simulation results; In terms of daylighting, the illuminance simulation results were visualized as false color graphics, based on a set scale of 0 to 1000 lux.
At the same time, the percentage of analysis grid nodes with a illuminance reading of less than 200 lux was calculated as an indication of the proportion of floor area with insufficient light.
Similarly, the percentage of nodes with more than 900 lux was calculated to indicate the proportion of area with excessive light levels, leading to issues of glare and visual discomfort. In general, the main issue for the base case was that more than sixty percent of the space was always receiving insufficient light (Fig. 3).

Compilation and analysis of daylight simulation results
Over the course of the day, the distribution of daylight varied according to the sun position, with the south facade facing the least issue of excessive light. Given the lack of site context and building's uniform profile, the daylight performance did not vary significantly with height. (Fig. 4).

Analysis of daylight simulation results over the course of the day
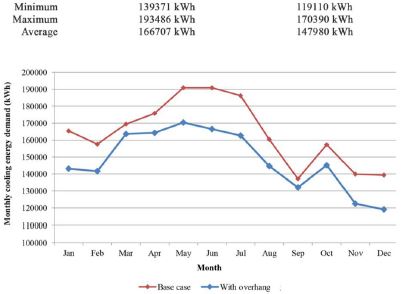
The thermal load analysis was conducted over the entire year, with the data obtained on a per month basis. On the whole, the cooling energy demand followed the overall trend for outdoor and indoor air temperatures, with a higher energy consumption in the months with higher mean temperatures (Fig. 5).

Graph plotting monthly average indoor and outdoor temperature and cooling energy consumptio
Given the findings from the base case analysis, the multiple variant analysis method was applied to explore strategies to increase daylight penetration.
For each strategy, the design parameters were incrementally varied via parametric Grasshopper definitions, so as to produce numerous design variants.
- Ratio of glazing surface area to floor area; As evidenced in Figure 6, the buildings with a higher ratio of glazing surface area to floor area recorded a lower percentage of area with insufficient light and hence, correlated with better daylight performance. Yet, this also implied a higher energy consumption from cooling, due to the heat gain from increased solar radiation.
The converse trend of reduced daylight and heat gain due to a lower ratio was less apparent. The circle and polygon shaped buildings seemed to experience a decrease in the proportion of area with insufficient light, despite their ratios being lower than that of the base case. Yet, their cooling energy demand was lower, as per the expected trend.

Analysis grid results of varying ratio of glazing surface to floor area
In general, the multiple variant analysis results (Fig. 7) suggest that increasing the glazing surface area in relation to floor plate area of a building, will increase daylight.

Graph plotting the daylight and energy performance of each design variant against its ratio of glazing to floor area
- Cut-outs / voids; The introduction of voids was tested both in terms of the effect of the position of the voids as well as its size as a percentage of the floor area of the base case. Based on daylight performance, positioning the void at the edge of the floor plate was more effective in improving daylight performance, as evidenced in Figure 8, particularly if the void was spread out over more than one edge. This could be due to lesser self-shading and greater daylight access at the edge rather than in the centre. In terms of size, increasing the percentage of area as cut-out increased the daylight performance proportionately by decreasing the proportion of the area with insufficient light. However, the cooling energy calculations for these cases were inconclusive and did not seem to reflect the trend in daylight levels.

Analysis grid results of introducing voids and varying the size of these voids
- Curved edge; For this strategy, it was necessary to simplify the facade curvature to flat panels before any thermal calculations could be carried out as DIVA is unable to analyse non-planar surfaces.
In general, increasing the depth of curvature resulted in a proportional improvement in daylight performance (Fig. 9). As seen in previous simulations, this also correlated to an increase in radiant heat gain and hence, cooling energy demand.

Analysis grid results of varying the depth of curve
However, Figure 10 suggests that with excessive curvature the daylight performance improvement approached a plateau, with each increase in depth resulting in a less significant increase in daylight penetration. Based on these findings, it was possible to derive a set of basic daylight optimization guidelines that could be subsequently applied to the schematic building design. (Table 2)

Graph plotting the daylight and energy performance of each design variant against its curve depth
Summary of optimization guidelines derived based on simulation results
4.2. Method 2: Using Simulation Data as Parametric Input
In this method, an initial simulation analysis formed the data input for parametric manipulation. This method firstly involved setting up the base case within a site context and conducting a solar irradiation study. An architectural variable was then defined such that the irradiation data collected initially could be used as an input in the parametric definition in Grasshopper to control the selected variable. This facilitates the generation of an alternative design variant that directly responds to the performance of the base case. A daylight and heat gain simulation of this variant would then allow for a performance comparison with the base case, such that any issues could be used as feedback to further modify the parametric definition.
While the first method took advantage of the speed and efficiency of the integrated workflow, this method was derived based on another benefit - the ability to directly process simulation data within Grasshopper itself due to the integrated, single-software platform of the proposed workflow.
- Settings; The base case settings from Method 1 were mostly kept constant in this method, with the exception of the site context. The building as modeled in this setting was placed within the urban context of Marina Bay, Singapore as an experimental site for the base case.
As mentioned, for a tall building, the density of the urban context can be an important external condition that can influence how the micro-climate of the site varies with height. Hence, a site context was necessary for this base case to understand the impact of shading from surrounding buildings.
- Simulation Results; This method firstly required a solar irradiation analysis, which formed the data input for subsequent steps - this analysis was conducted over a run period of a year. As illustrated in Figure 11, the east and north facades of the building received less radiation at a lower height due to the density of surrounding buildings.

Solar irradiation analysis of base case
In terms of daylight, the illuminance levels within the space were lower than those recorded in the isolated base case in Method 1 as seen by the increase in proportion of area with insufficient light (Fig. 12).

Compilation of daylight simulation results
While Method 1 was applied to investigate strategies to increase indoor daylight levels, this method was used to study strategies to reduce heat gain due to solar radiation. In particular, the focus was on the design of horizontal shading in the form of overhangs.
To do this, the base case irradiation data was used to define the depth of the overhang at each point on the building's facade. Higher irradiation levels translated to deeper overhangs, as the greater radiant heat gain in that area would require more extensive shading. Thus, the design of the overhang would be directly influenced by the external micro-climate and would be unique to its context. Figure 13 illustrates the Grasshopper definition used to relate the simulation data input to the original geometry to parametrically generate the overhang design. A similar process could also be used to control other variables such as the size of openings.

Parametric definition to link simulation data as input to control overhang
One key consideration is the need to process the initial simulation data before using it as a data input. For example, the irradiation values obtained in this example were between 0 to 300 lux - directly using this data would have resulted in shallow and ineffective overhangs. Hence, the data was multiplied by a factor to produce more appropriate values - however, this factor was arbitrarily defined and could limit the effectiveness of this method. It is important to analyse the performance of the new design variant and use this as feedback to modify this factor.
On the whole, the design variant reduced the amount of heat entering the building and hence, decreased its cooling energy demand (Table 3) by about eleven percent. Also, the overhangs reduced the proportion of area with excessive daylight and hence, could have reduced glare and visual discomfort. However, the overhangs also decreased the overall daylight levels within the space, with a ten percent increase in the proportion of area with insufficient light. While the design variant was more effective in reducing heat gain, it experienced significantly low levels of indoor daylight.
Comparison of daylighting and energy performance of base case and design variant
This may imply a need to tweak the multiplication factor applied so as to improve the balance between daylight and energy performance. However, given that the base case already experienced poor daylight performance, a possible alternative could be to use the findings from Method 1 to first improve the building's daylight performance, before applying Method 2 to negotiate the negative issues of heat gain and glare.
5. Conclusion
In conclusion, through this research, it was possible to firstly validate the effectiveness of the proposed workflow and secondly, explore different daylighting strategies in the context of tall buildings. Two methods were devised to apply this workflow with the help of DIVA and Rhino/Grasshopper - the first used a multiple variant analysis while the second applied the simulation data as an input in the parametric definition.
The contribution from this research is to suggest direct and intuitive design methods to architects with concerning of daylight strategies and energy performance while they are still explore schematic design. In particular, the conceptual aims of introducing diversity and interactive office space in a tall building could be integrated with the optimized daylight needs. The complex nature of a tall building design implies that with the integrated workflow, environmental simulation could be carried out more effectively at every stage of the design process. Also, the daylighting strategies explored could be applied and adapted to develop schemes easily with awareness of daylight conditions and resulted energy performance of project.
The basic massing study could be more effectively achieved based on the strategies explored in Method 1, with the use of few variants to increase daylight penetration, particularly into the centre of the building.
At a later stage, the overall facade design could be based on an application of Method 2 to find specific strategies that can reduce the heat gain from the increased daylight penetration.
However, there are some limitations to the capabilities of DIVA 2.0, particularly in terms of thermal simulations. DIVA is only able to carry out analysis of a single thermal zone and is unable to analyze curved surfaces, limiting its ability to handle more complex forms, with multiple spaces. Yet, this software is continuously being updated such that the proposed integrated workflow could prove to be even more useful over time.
Acknowledgments
This work was supported by the Dept. of Architecture at the National University of Singapore (#R295000109133).
Notes
References
- CTBUH, “2011: A Tall Building Review.”, CTBUH Journal, no.2012 (1), (2012).
- Pank, W., et al. , Tall Buildings and Sustainability, Corporation of London, (2002).
- Ander, G., Daylighting Performance and Design, New York, Van Nostrand Reinhold, p1, (1995).
- Gonclaves, J., The Environmental Performance of Tall Buildings, Earthscan, (2010).
- Niemasz, J., Diva for Rhino - Environmental analysis for buildings, Available from http://diva4rhino.com/.
- Clair, P., The Climate of Tall Buildings: An Investigation of Building Height in Bio-climatic Design, p6, (2010).
- Richman, E., “Requirements for Lighting Levels.”, Toolbox, The Engineering. Illuminance - Recommended Light Levels, (2010), Available from http://www.engineeringtoolbox.com/.
- Bechthold, M., et al. , Integrated Environmental Design and Robotic Fabrication Workflow for Ceramic Shading Systems, the proceedings of ISAAC, (2010).
- Lagios, K., et al. , Animated Building Performance Simulation (ABPS)-Linking Rhinoceros/Grasshopper with Radiance/Daysim, the proceedings of SimBuild, New York, (2010).
- Niemasz, Jeff., , Diva for Rhino - Environmental analysis for buildings, Available from http://diva4rhino.com/.
- UTO, Geco, (2012), Available at http://www.food4rhino.com/project/geco?ufh.
- Marvin, M., et al. , Gerilla: Grasshopper to EnergyPlus, (2011), Available at http://www.architexted.com/gerilla-grasshopper-to-energyplus/.
- Lockyear, B., Heliotrope, Available at http://www.grasshopper3d.com/group/heliotrope.