An Analysis on Building Shading Plan for a City Hall considering Energy Saving
© Copyright Korea Institute of Ecological Architecture and Environment
Abstract
Recently, many public office buildings which were built by curtain wall increased rapidly, but the results of the investigation of the government, these buildings have been found that the heating and cooling thermal load is high, and showed low energy efficiency.
To evaluate the effects by applying outdoor louver and indoor blind, which can control solar radiation in order to reduce the heating and cooling load of public office building which was built by glass curtain wall. The heating and cooling load was calculated via Energyplus, building and outdoor louver, indoor blind were modeled by Google sketchup connected to Energyplus.
The results of this study were as follows; the case of applying various outdoor louver, the heating and cooling load all decreased as compared to the case without applying outdoor louver, the case of applying indoor blind, the heating and cooling load decreased as compared to the case without applying indoor blind, but indoor blind showed low energy performance comparing outdoor louver.
Keywords:
Louver, Solar Radiation, Heating Cooling Load, Energy Saving1. Introduction
1.1. Objectives
Recently, a lot of local government office buildings constructed with curtain walls has been rapidly increasing. The report of the building energy efficiency rating analysis performed by the Korea Institute of Construction Technology showed that the energy consumptions of Y, Seong-nam, and Cheon-an city halls were 791.3, 603.3, and 422.2 kWh/㎡yr, which were off-grade (less than fifth grade), off-grade, and fourth grade. The building energy efficiency rating system is designed to analyze the energy efficiency of newly constructed apartment houses or commercial buildings, and to determine their grade according to the yearly energy consumption per unit area (kWh/㎡yr)[1].
A glass curtain wall can give people a good feeling with its openness and spectacular appearance, but it has some thermal weakness in preventing radiant heat and cold air from entering through the window due to its sensitivity to instantaneous climate change from the outside. Looking at the case of the same floor in a building during daylight hours in winter, the south-facing room requires cooling due to the hot indoor air even in winter, whereas the north-facing room needs to be heated due to the chilly indoor air. As identified in this case, the building made with glass curtain walls eventually consumes more heating and cooling energy. Especially during the summer months when the electric energy supply and demand situation is poor, the energy problem of public buildings constructed with glass curtain walls is considered a very sensitive issue. To solve this, optimum building envelope design is indispensable. But at design stage, it is very difficult to predict precise energy performance because there are many variables affecting energy performance such as envelope composition, window wall ratio, building direction, louvers, blinds, zoning, and etc. So, a detailed building energy simulation can be a good solution for predicting energy performance at design stage.
In this regard, This study tried to show accuracy of detailed building energy simulation tool through comparing actual measured and simulated data. And also, using simulation tool, to reduce energy consumption of curtain wall building, this study suggests the most energy efficient shading type for a city hall building.
1.2. Research Process
For the objective of this study, Y city hall was selected as the primary target. this study collected and analyzed the energy consumption data of local government office buildings. The collected actual energy consumption data were compared to calculated (simulated) value. The heating and cooling loads were determined through a comparative analysis using the EnergyPlus, after controlling weather file conditions with actual measured temperatures.
And various type of outdoor/indoor louvers (blinds) were applied and annual thermal loads were simulated using EnergyPlus.
2. Previous Studies
Previous studies related to the contents of this study are as follows. 2 of 5 papers covered public building energy saving. Kwon Young-jun et al. suggested the design requirements for awnings to minimize energy consumption in buildings and devised a simple formula for the simple design application of such requirements [2]. The length of the awning was calculated using a simple formula that considers the incidence angle of the sun, and the optimum value was derived by calculating the sum of the heating energies of awnings with different heights and lengths. Lee Hoon et al. estimated the total energy consumption of office buildings with curtain walls and calibrated the estimates via the actual energy consumption of the buildings and statistical methods [3]. Based on these data, they discussed selection methods for building envelopes that can improve building energy performance for the remodeling of office buildings with curtain wall structures, by evaluating the building energy performance in case of changes in the envelopes. Son Ji-hun et al. ranked passive elements in terms of their energy savings effects by comparing their energy savings ratios through simulation of public office buildings, and presented seven kinds of passive elements for improving the energy performance of buildings, such as replacement of windows and doors, thermal transmittance of windows, and the window area, shielding factor, awning devices, infiltration rate, and application of a greenery system [4]. Son JI-hun et al. investigated energy saving methods for public buildings in Korea [5]. They presented various technologies, such as the installation of high-insulation windows; the introduction of the BEMS system, renewable energy equipment, and heavy water treatment facilities; the use of insulating glass; high-performance insulation, and rooftop landscaping, and proposed energy-saving measures through case studies of low-energy public buildings in Korea and abroad and their annual energy consumption, based on the efficient identification of energy-saving standards and policies. Kim Jeong-yun et al. investigated the effects of indoor heat on buildings with curtain walls through a simulation, and analyzed methods of reducing the energy consumption of such buildings [6]. They concluded that the reduction of the heating and cooling loads by the indoor heat can improve the cost-effectiveness of the functional glass and increase the economic effects of the reduction of electric energy and the cooling energy savings.
Unlike previous studies, this study investigated actual building energy consumption data, and calculated the heating and cooling load values using dynamic building energy simulation tool focusing on optimization of louver. This study also checked the reliability of the simulation by comparing the simulation results based on weather data and the actual measurements.
3. Comparison of measured and calculated values
3.1. Summary of the target building
The Y government office building located in Y city, Gyeonggido, which had the highest energy consumption among local government office buildings in 2009 and was determined to ‘off-grade’ in its energy efficiency rating evaluation at the end of 2010, was selected as the target building. Table 1 shows an overview of the building.

Perspective of the target building

Space use and simulation model(south)

Office area-Typical floor plan(mm)

Overview of the target building
3.2. Modeling of the target building
Figure 1 presents a perspective of the target building, and Figure 2 shows the building in the south directions, which were modeled using Google SketchUp for EnergyPlus simulation. The target building was modeled based on the drawings of the actual building. The azimuth of building is 10° to west from south. The comparison of Figure 1 and Figure 2 revealed a difference between the bird's eye view and the model. That is, although the city hall, parliament building, and culture and arts center are all connected to the government office building, this study modeled only the city hall(office building) because it was the primary energy consuming target. Figure 3 shows a typical floor plan for the work space (6-15 floors) in which various awnings will be applied inside and outside the building to compare the resulting energy consumption.
Table 2 shows the input values in simulation, which are based on design drawings of target building.
Basic simulation input values
3.3. Comparison of actual and simulated energy usage
Figure 4 shows the comparison of the annual total energy consumption of the target building from 2007 to 2012. This total energy is consisted of heating/cooling/hot water/light energy and expressed in TOE unit. Through application of energy saving methods such as supplementary insulation, high efficiency lights, indoor setpoint temperature control and voluntary energy saving efforts, the target building reduced a large energy up to 40% in 2012. Figure 6 shows the results of the comparison of the actual energy consumption in 2012 and the calculated values of the EnergyPlus (E+) loads by yearly(Fig. 5). The actual energy consumption (only heating, cooling and lighting energy were considered) of target building in 2012 and the calculated load value in simulation were 107.8 kWh/㎡yr and 96.2 kWh/㎡yr, respectively. A relative error of 10.8% occurred because the simulation energy consumption is the sum of the heating/cooling loads and the lighting loads, and the actual energy consumption in 2012 included various heat losses besides the heating/cooling and lighting loads.

Actual total energy usage of the entire target building (2007~2012)

Actual energy usage and calculated load by yearly (2012)

Measurement of solar radiation(A)

Measurement of indoor temperature and humidity(B)
3.4. Short term comparison of measured and calculated indoor environment results
Figure 6 and 7 present the measurements of the solar radiation and the humidity/temperature by the window(B in Fig. 3), and the temperature/humidity were measured at the center of the room of the target building(C in Fig. 3). Figure 8 shows comparison of the measured indoor/outdoor air temperatures and calculated temperatures by E+ during measurement period. Although measured and calculated temperatures show consistent tendency, they can't be compared by time because initial values are not same. The measured outdoor temperature, relative humidity and solar radiation are different from the weather data of E+. So, to compare measured and calculated value precisely, we changed weather data of E+ with measured data (8/19 10:00~ 8/23: 15:00. 2013) and simulated it again.
Figure 9 shows the comparison of measured temperature and calculated temperature of out and indoor building. Since the outdoor air temperature in weather file was changed to measured outdoor temperature, the measured and calculated outdoor air temperature shows good match. Between 9 and 18 hour, the calculated (E+) indoor temperatures were fixed to 28℃, which was indoor setpoint temperature because the indoor air temperature is ideally controlled in simulation. But the measured indoor temperatures were changed according to outdoor air temperatures from 27℃ to 32℃, because actual HVAC system can’t satisfy setpoint temperature ideally. The average relative errors between measured and calculated indoor temperature was 6.7% and the maximum error was 19.0%.

Comparison of measured and calculated temperature

Comparison of measured and calculated(controlled) temperature
4. Cooling load reduction plan and analysis
4.1. Shade setting conditions
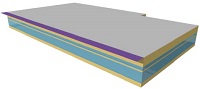
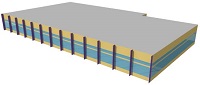
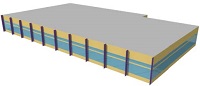
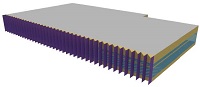
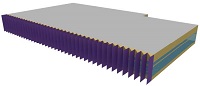
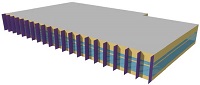
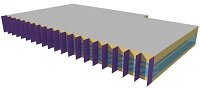
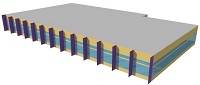
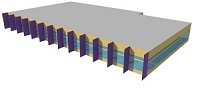
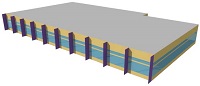
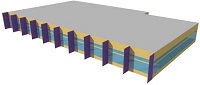
Since the building has a large window area ratio, is used for business purposes and operates only during the daylight hours, the proportion of cooling load is larger than heating load. In addition, the analysis of load reduction effects according to the installation of shades, which is the aim of this study, is mainly related to the cooling load. Vertical/horizontal shades were applied inside and outside the work area (5-16 floors). The external shade was applied only to the south of the target building. And the horizontal louver shade was installed at a height of the slab between the floors, with lengths of 0.5m, 1m and 1.5m, and a distance of 4.2m(floor height of the work area), and the vertical shade was installed, with lengths of 0.5m, 1m and 1.5m, and spacings of 1m, 2m, 3m and 4m, totaling 15 kinds of shades. The above Table 3 shows setting conditions for the external shade. And as internal shades, blind, which is the most common, was adopted to target building. The internal blind was set to be fully blocking out solar radiation from April to October, and be fully opened from November to March.
Design condition of outdoor shades
4.2. Cooling load results according to shading conditions
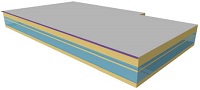
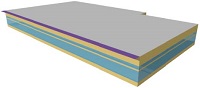
First, an analysis of annual heating and cooling loads due to the installation of internal shades was carried out. Figure 10 shows a comparison of solar irradiation according to the presence of internal shades for a specific day. The indoor solar irradiation was found to be further decreased when the internal shade was installed.
Figure 11 shows a comparison of annual heating and cooling loads due to the installation of internal shades. When the internal shades were installed, the cooling load was decreased by 15.8%, whereas the heating load was increased by 0.39%. In addition, there was a 13.03% decrease in the amount of annual thermal loads.

Comparison of incident solar radiation with indoor blind

Annual heating and cooling load with indoor blind
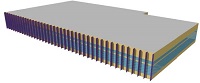
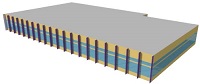
Figure 12 shows a comparison of annual heating and cooling loads in work space (5-16 floors) according to the type of external shade. The annual heating and cooling loads were reduced as the length of the horizontal shade increased, and the spacing between vertical shades was narrowed in length of each shade. The cooling load was reduced from 0.91% up to 13.15%, whereas the heating load was increased from 0.32% up to 60%. The annual thermal load saving rate of the external shades ranged from 0.73% up to 4.53%, and the horizontal shade (1.5m) showed the largest heating and cooling load reduction effects with a 4.53% reduction in heating and cooling loads.

Annual heating and cooling load with various outdoor shades
5. Conclusion
In this study, load reduction effects were analyzed through dynamic building energy analysis by applying internal and external shades that can adjust the amount of solar irradiation entering inside the building to reduce heating and cooling loads as a part of the method for energy savings in public buildings of provincial governments.
For study on validity of simulation, the actual energy consumption of Y city hall in 2012 was compared with the simulation result. The annual load comparison result showed that both values were very similar with a relative error of 10.8%. A comparison between temperature measurement and analysis values revealed that the indoor temperature was higher than the outdoor temperature at all times because solar radiation heats room floor. In addition, a comparison between measured temperatures and weather file controlled simulation results found that the two values exhibited very similar graph patterns, showing similar results of measurement and analysis values.
According to the results of analysis on internal shade, the cooling load was decreased by 15.8%, whereas the heating load was increased by 0.39%. And there was a 13.03% decrease in the amount of annual heating and cooling loads.
The results of analysis on external shade showed that the energy consumption was reduced as the length of the horizontal shade increased, and the spacing between vertical shades was narrowed in length of each shade. Of these, the horizontal shade (1.5m) exhibited the highest energy saving rate with a 4.53% reduction in heating and cooling loads.
If the installation spacing between vertical shades is narrowed, and the length of the shade increased, the cooling load is reduced, but the heating load is significantly increased, which in turn increases the total heating and cooling loads. Therefore, it is desirable to apply the horizontal shade which further facilitates the installation compared to the vertical shade by optimizing its length.
In addition, there is a need to consider the fact that active utilization of indoor blinds during summer months can reduce much more cooling load than external fixed shade. And a combination of active external and internal shade can be helpful to reduce more thermal loads. Using external shade can affect on indoor task lighting circumstance, but this study neglected indoor shading effect, focusing on saving thermal loads of whole work spaces.
Acknowledgments
This research was supported by 2010 Basic Science Research Program through the National Research Foundation of Korea (NRF) funded by the Ministry of Education, Science and Technology (2010-0025756) This was supported by Korea National University of Transportation in 2015
References
- A news report on Excessive energy consuming public building of local government, Ministry of public administration and security of KOREA, (2010), 2.
- Kwon, Y. J., Lee, T. G., Cho, K. M., and Kim, J. H., A Study on Shading Design to Minimize Heating and Cooling Energy Demand, Korean Journal of the korea institute of ecological architecture and environment(KIAEBS), 2011-11, p67-72, (2011).
- Kim, J. S., Lee, H., Oh, M. S., and Kim, H. S., A Study on Improvements of Envelope System for The Energy Saving in Curtain Wall Office Buildings, Korean Journal of KIAEBS, 6, p106-113, (2012).
- Son, J. H., and Kim, S., A Study on Energy Reduction of Passive Factor Apply for the Improvement of Energy Performance in Public Building, Korean Journal of the Korean solar energy society, 31, p196-201, (2011).
- Son, J. H., and Kin, S., A Study on Energy Saving Way of Domestic Public Buildings, Korean Magazine of the SAREK, 7, p625-630, (2011).
- Kim, J. Y., Yook, I. S., Nam, H. J., Lee, J. S., Kim, J. M., and Cho, S, The Impact of Internal heat gain on Heating and Cooling Load in Curtain Wall Office Buildings, Korean Magazine of the SAREK, 6, p925-930, (2008).