Development of Initial Design Stage Guidelines for nearly Zero Energy Offices :A Central-Climate Zone of Korea Case Study
ⓒ Copyright Korea Institute of Ecological Architecture and Environment
Abstract
This study aimed to develop a design manual to be used during the initial stage of the nearly Zero Energy Building (nZEB) design process. Recently, with the increased demand for nZEBs, there are many architects and architectural firms who are becoming interested in nZEB design. However, since the nZEB design process requires a different approach to the conventional building design process, architects have difficulties with application of the nZEB design process in their projects. Therefore, a design manual which can be used in the nZEB design process was developed in this study. Based on an intensive literature review, energy-saving strategies and their performance levels, which affect heating and cooling energy consumptions were established for a reference building. To analyze the sensitivity of each energy strategy to the overall performance, computer simulations using EnergyPlus were performed. At the same time, an Analysis of Variance assessment was conducted to estimate the relative importance of each energy factor. The energy sensitivity and priority of the energy factors was developed into a set of design guidelines.
Keywords:
nearly Zero Energy Building, Energy Consumption, Design Parameters, Zero Energy Design Process, Design Guideline1. Introduction
1.1. Background and Purpose of Study
nearly Zero Energy Building (nZEB) is a new concept introduced by EU Directive, where nZEB is defined as a building that has a very high energy performance and nearly zero or very low amount of energy required should be covered to a very significant extent by energy saving strategies.
In the coming years, the building design community at large will be compelled by mandatory codes and standards that aim to reach nearly zero energy buildings (nZEBs).1) The Korean Ministry of Land, Infrastructure and Transport will require all new buildings to be “nearly Zero Energy” buildings by 2020.2) As building performance objectives become more ambitious and absolute, the number of energy reducing measures and their complexity of operations and design implementation tends to increase.
In common practice, when designers decide to improve building performance, they usually make estimates of the design variables to be modified, such as the building envelope, form, etc., and run many simulations. Designers will then try to establish the effect of the design changes on the simulation results and conclude a relationship between those variables and the objectives of the simulation. Due to its complexity, this procedure is considered inefficient in terms of time and labor.3) The relationship between the simulation variables and objectives may not be straightforward, especially when there are many parameters to be studied and the problem may be non-linear, meaning that a better design is not always guaranteed.
It is noteworthy that the initial design stages form the foundation of all new building designs. During these stages, the general size, orientation and construction of the building are defined; all subsequent decisions and design calculations are based on these characteristics. It is therefore essential that architects are able to evaluate their designs before important building characteristics are considered to be frozen. However, during the early design stage in most Korean architectural and engineering firms, the phasing of the design process is often undertaken at pace and so sufficient evaluation is difficult. In particular, there is usually inadequate time and budget to run a computer simulation of each structure. In this context, providing a set of design guidelines that shows a realistic design direction can be a way to ensure that important issues are addressed when realizing nZEBs. This study developed a design manual that architects can apply during the initial design stages.
This study intends to develop design guidelines which can easily be used for achieving a nZEB office situated in the central climatic zone of Korea during the early design stage. Although there have been a number of studies for offices and other building types, no attempt has yet been made to present guidelines with a priority of design variables and their energy sensitivity for offices in Korea. Based on an intensive literature review, energy-related design variables and performance levels which affect the energy consumption were established for a reference building. To analyze the sensitivity of the overall performance to each energy-related design variable, an Orthogonal Array was used to decrease the number of experiments to 81. A reduction in the number of simulations in EnergyPlus was made possible, despite the fact that the number of combinations was 324.At the same time, an Analysis of Variance(ANOVA) was conducted to estimate the relative importance of each energy parameter. The results of the ANOVA were used as data to develop the design manual for nZEBs.
2. The nZEB Design Process
2.1. Importance of the Initial Design Stage in the nZEB Design process
Architects typically follow a top–down design procedure, which consists of starting with the building as a whole and then working down to smaller details, such as the wall finishes. This process is divided into several design stages. Even though the definition and detail of the various design stages may vary between designers, the basic idea remains the same. The initial design stages form the foundation of all new building designs. During these stages, the general size, orientation and shape of the building are defined. All subsequent decisions and design calculations are based on these characteristics. It therefore becomes more difficult and costly to alter the design as it progresses. Decisions made without careful consideration or knowledge of their consequences can thus have a dire effect. This top–down design practice has evolved over a long period of time and it is therefore unlikely that it will change radically in the foreseeable future. Energy-efficient design strategies for nZEBs need to take this into consideration.
2.2. Design Supportive Tool and Guidelines
The nZEB Design process, as shown in Fig. 1, is suggested as a simple means of achieving energy efficient buildings.4) In the design proposal, minimizing the building load, which is mainly affected by the building shape, form and thermal characteristics of the building is the first step. This early design phase is mostly in the hands of architects, with very limited influence on the part of the engineers. Architectural design decisions consequently have a significant effect on the building load and thus the nearly Zero Energy criteria.

The nZEB design process
Many architects have observed that designing nearly Zero Energy Buildings (nZEB) in the early design phase requires more calculations than a conventional design. Building simulation is seen as an ideal tool for aiding designers with the energy consumption analysis. Using a simulation tool it is possible to determine what effect various design decisions will have on the building load. Most of the information needed for simulation is not yet available during the preliminary design stages when analysis is most needed. Moreover, most architects have found that their current level of technical knowledge for simulations was too low. Despite the greater necessity for technical knowledge for the building simulations, few architects try to attain technical knowledge for building simulations and calculations. Instead, simple rules of thumb are often used in collaboration with engineers. Some of the architects clearly stated that they did not want to gain extensive knowledge of these simulations because it would be too costly. Traditional and graphic design guidelines, which include simple rules of thumb, are still used by many architects, since they provide a more direct insight and aid in decision-making.
3. Conditions of the Design Manual
3.1. Critical Variables
There are two elements that need to be considered when establishing the critical input parameters for the architectural design tool. The first consists of determining whether the parameter has a significant effect on the thermal response of the building. The second involves focusing on parameters that are directly influenced by architectural design decisions. During the preliminary design stages, architectural design decisions consist mainly of defining the building size, form, glazing and general construction. Identifying the important parameters however is not that simple, since they can influence one another. A study conducted by Shaviv5) on typical Israeli residential buildings revealed that design parameters can be divided into three categories
The first of Shaviv's three categories consists of parameters with a weak effect on the building thermal performance, which are thus insensitive to other design parameters. Parameters that have a strong influence but are not affected by other design parameters form the second category. The third category consists of parameters that have a strong effect on the building performance and are also sensitive to other parameters. Using the above categories as a basis it is possible to reduce the input requirements for the architectural design tool. Parameters of the first and second categories, such as the internal loads, ventilation, temperature set points and operating hours can be modified during the final design stage without compromising other design features. They thus require little attention and can be specified using default values. The third group forms the critical input parameters for thermal simulation
3.2. Framework of the Design Guidelines
In order to establish the critical input parameters for the design tool, a sensitivity analysis was performed. This consisted of changing the design parameter of interest and noting the effect that the change has on the building load. The average value of the data indicates the typical influence that the parameter has on the building load. The standard deviation of the data from the mean value shows how much the parameter is influenced by other design criteria. Critical parameters would on average cause a large change in the building load relative to a small change in the design parameter. This relationship is referred to as the sensitivity ratio. Except for the construction material, the sensitivity ratio of the analyzed parameters was calculated as the percentage change in load, divided by the percentage change in the design parameter. The choice of construction material affects the thermal mass and conductivity and it is therefore difficult to express in terms of a change in one parameter. The construction material ratio is consequently defined as the percentage change in load due to a change in material
The priority in applying variables is decided by their contribution to energy savings, which means improved performance of the variables and subsequently an amount of energy which is saved. Larger energy savings and an improved performance can be translated into a greater contribution. The cooling load is different from the heating load in Korea, and therefore the priority of variables will vary depending on the thermal loads. It may be necessary to deduce priorities by separating the cooling and heating to identify the features of variables. However, as the design manual has to prioritize variables so that they can be applied to the design, analyzing the priority for the entire load is required
Not all architects are able to give a clear and visual overview of the impact of energy related decisions on the architecture. A design guideline is therefore necessary as it can be seen as a road map of example design decisions and its impact on the energy consumption. Such guidelines can be presented to others to show which steps were necessary in order to reach the desired energy use.
4. Energy-related Design Variables and Sensitivity Analysis
4.1. Energy-related Design Variables and Description of the Reference Building
There are many design parameters that affect the energy consumption of office buildings at every stage. Based on an intensive literature review, the many parameters were narrowed down to 24 main factors which affect the energy consumption of office buildings(Table 1).

Design parameters affecting Energy Consumption
In order to analyze the priorities of the parameters chosen above, practically applicable ranges for each design parameter in the building have been set. Based on investigated data, which encompasses performances from the minimum level regulated by the building code to commercialized cutting edge technologies. The ranges for each parameter can be found in Table 2
Applicable performance ranges of each Energy-related Design
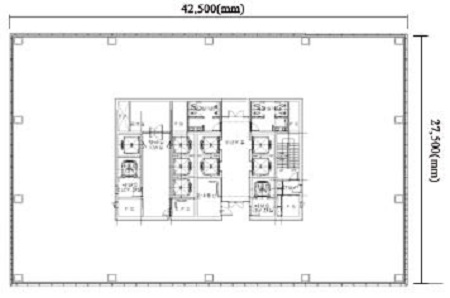
The reference building forms a very important part in the analysis because all of the subsequent calculations and analyses are based on a comparison with it. A reference building has been established from a survey of 178 office building drawings(gross floor area 30,000m2 – 50,000m2) in Seoul. The characteristics of the reference building were determined by careful examination of a typical design. Most office buildings in Korea, as seen in Fig.3, are of a basic module type with a central building core. Fig. 3 shows a simplified drawing of a model constructed for simulation. A brief description of the reference building and its characteristics of operation are given in Table 3.

Design Guideline
Brief Description of Reference Model
A lack of a strategy to control experimental conditions and outcomes beforehand may yield undesirable results with numerous errors, and there is therefore a need for a Design of Experiments (DoE). Practically, DoE is a technique for laying out multiple variable conditions, and can be applied to experiments with discrete and independent variables. DoE allows for an efficient and effectively reduced number of experiments. It can be classified into three methods, a full-factorial experiment, a fractional (or partial)- factorial experiment, and a one-at-a-time experiment. Given n parameters to be tested, a straightforward full-factorial design requires 2n experiments, i.e., if there are 15 parameters with two level variants, the experiment requires 215=32,768 repetitions with a change of inputs each time. To resolve this problem, Taguchi demonstrated that the number of runs can be significantly reduced based on a degrees-of-freedom approach as given below:
| Eq.(1) |
where N is the total number of experiments required, NV is the number of independent variables, and L is the number of bound levels. Eq. (1) shows that the 32,768 experiments from the above example can be reduced to only 16 repetitions. Taguchi's break through involved a new adaptation to the conventional DoE method, and was developed into a robust design philosophy referred to as the Taguchi method. Based on Eq.(1), the Taguchi method offers pre-manipulated combinatorial design tables called orthogonal arrays that contain a finite set of variable combinations. The user can adopt the most adequate orthogonal array according to the number of parameters and input levels of each.
A full factorial experiment is an experiment whose design consists of two or more factors, each with discrete possible levels and whose experimental units take all possible combinations of all those levels across all such factors. Such an experiment allows study of the effect of each factor on the response variable, as well as on the effects of interactions between factors on the response variable. In this research, an experimental design is chosen with all input factors set at three possible levels each. If there are k factors, each at 3 levels, a full factorial design has 3k runs, therefore for 3 factors at three levels it would take 27 trial runs[59]. The many parameters were narrowed down to 24 factors which mainly affect the energy consumption of office buildings, so if the 24 variables presented in Table 4 are changed to posses only three levels, as many as 324(which is equal to 282,429,536,481)simulations will be required.(Table 4).
Applicable Performance Ranges of each Energy-related Design Parameter
4.2. Energy Simulation with the EnergyPlus Program
The simulations for load calculations were undertaken using the EnergyPlus program and a database for the analysis of variance was established based on the simulation results (Table 5). Seoul weather data, gathered by the Korea Meteorological Administration (KMA), was converted to Typical Meteorological Year version 2 (TMY2) format, which is one of the EnergyPlus weather data types. There are three distinct climatic zones in Korea, with the analysis being undertaken for Seoul, the representative location for the “central climatic zone”. Another simulation condition is shown in Table 6. The results of the simulations show that the average annual energy consumption is 68.58 kWh/m2yr.
Simulation Results(kWh/m2yr)
Brief Description of the Simulation Conditions
4.3. Analysis of Variance (ANOVA)
The contribution of design variables, which is the difference between the total mean value and the mean value per level of each design variable, represents the effect on the total load given by each design variable. The contribution of each design variable per level can be seen in from Equations 2 & 3, where PA0 & PA1 are the contributions when the design variable A is 0 and 1, respectively. PB0 is the contribution when the design variable B is 0. The contribution of other design variables per level was also calculated using the same method.
| Eq.2 |
| Eq.3 |
| Eq.4 |
| Eq.5 |
PAi, Bi: contribution of each parameter on i level.
Yi: load of each test calculated by simulation
Tm: total mean value of load calculated by 81 simulations
The parameters which have a significant contribution at a 5% significant level (p-value) in ANOVA were selected as the contributing energy factors, and the non significant terms (p-value greater than 0.05) were eliminated. The results of the ANOVA Analysis are shown below (Table 7).
ANOVA Results
The results show that only 8 parameters were selected as significant factors for the energy consumption. These parameters are the Surface Floor Ratio, Floor to Floor Height, Width to Depth Ratio, Orientation, Wall U-factor (Wall), Window U-factor (North), SHGC (West), Visual Lighting Transmittance (VLT, South). It was found that the other variables’ contributions were negligible (Table 8).
Percentage Contribution to Heating Energy Consumption
The most influential factor in the study was the wall insulation (the insulation of the office curtain wall). Though curtain walls are widely installed in more than 80% of office buildings in Korea, the performance is remarkably poor, which is attributed to the fact that the thermal bridge and air tightness have not been improved at all. This is considered to raise the influence of wall insulation. The WDR was found to affect total loads even when the cooling and heating load were separated for analysis, and the influence increased even further when it was analyzed with the total load. This occurs due to the country's seasonal characteristics. During the summer, buildings facing south are expected to experience longer solar radiation loads. On the other hand, buildings facing north experience a significant conduction loss during winter, which makes energy saving difficult. Window insulation was found to affect the energy consumption depending on the insulation performance for north-facing buildings and SHGC performance for south-facing ones, which affect the heating and cooling loads respectively. Consequently, the influence was still found to be effective even when analyzed with the total load. When the cooling and heating loads were analyzed separately for each direction, the pattern was totally different from what had existed. This is because the solar radiation load is advantageous to the heating load but disadvantageous to the cooling load. One pattern offsets the other when it was calculated with the total load.
5. Development of the Design Guildelines
The guidelines present the priority of valid variables based on previous study results. They also illustrate the level of energy savings on a bar graph and the energy consumption with each variable in sequence to help users' understanding. This is illustrated in Fig. 3.
The results of the study demonstrate that the insulation performance of the facade was the most significant factor that determined the energy consumption for office buildings that used curtain walls. This was thought to occur because their performance did not improve as significantly as that of the other variables did. It is therefore important to ensure that the thermal bridge and air tightness is addressed in curtain wall assembly and processing. Designers, for their part, should also design the curtain wall in a way that enhances the thermal bridge and air tightness performance. The WDR reflects the characteristics of Korean office buildings, where both cooling and heating loads occur seasonally. It is therefore recommended that building areas facing south and north should not be kept small. Additionally, architects must be attentive to the Floor to Floor Height, Orientation, Surface Floor Ratio, SHGC (West), U-Value of Window (North), and VLT in addressing concerns on energy-conscious primary office building designs. They should also give priority to the design variables selected in this research during the early design stage if they are to design energy-efficient office buildings effectively.
6. Conclusion
This study developed design guidelines for offices which simply shows the priority of variables. Through an intensive literature review, the main factors affecting energy consumption reduction were selected. The factors examined for the analysis include: Surface Floor Ratio, Floor to Floor Height, Width Depth Ratio, Orientation, Wall U-factor (Wall), Window U-factor (North), SHGC (West) and Visual Lighting Transmittance (South). By using orthogonal arrays, the number of simulations was reduced to 81. With the results of the simulations, an analysis of variance was conducted. The U-Value of the wall was found to have the most significant contribution, followed by the WDR, Floor to Floor Height, orientation, Surface Floor Ratio, SHGC(West), U-Value of Window(North) and Visual Transmittance. Architects must therefore be attentive to the selected factors above in energy-efficient office building design. Architects should also give priority to the design variables selected in this research and use the developed design guideline during the early design stage if they are to design energy conscious office buildings effectively. In order to increase the utilization of the design guidelines of this study, design guidelines should be developed with other climates and building usages.
Acknowledgments
This work was supported by the National Research Foundation of Korea(NRF) grant funded by the South Korean government (MSIP) (Grant No. NRF-2013R1A1A3013119).
Notes
References
- A. Athienitis, et al , (2010), Strategic design, optimisation, and modelling issues of netzero energy solar buildings, in: Proceeding of EuroSun 2010, Graz, Austria.
- Assessing gaps and needs for integrating building performance optimization tools in net zero energy buildings design, Shady Attia, Mohamed Hamdy, William O’Briend, Salvatore Carluccie.
- Beavan, L., et al , (1989), Architect’s job book: Volume 1 — Jobadministration, 5th ed, RIBA Publications.
- Hayter, S., et al , (2001), The Energy Design Process for Designing and Constructing High-Performance Buildings, in: Clima 2000/Napoli 2001 World Congress.
- Ho-Tae, S., (1997), A Study on the development of load prediction equation and design guidelines for the energy conservation of office buildings, Ph D Dissertation Department of Architecture Graduate School Seoul National University, 55.
-
Holm, D., (1993), Building thermal analyses: what the industry needs: the architect’s perspective, Building and Environment, 28(4), p405-7.
[https://doi.org/10.1016/0360-1323(93)90017-W]

- IEA. TASK 40/Annex 52, (2008), Towards net zero energy solar buildings, IEA SHC Task 40 and ECBCS Annex 52, http://www.ieashc.org/task40/index.html, 2011 (accessed 10.01.2011).
- Ivan, Korolijaa, et al , (2013), UK office buildings archetypal model as methodological approach in development of regression models for predicting building energy consumption from heating and cooling demands, Energy and Buildings, 60, p160.
- Kang, H.J., et al , (2013), The Development of the Sustainable Design Guideline for a School Building in the Early Design Stage.
- Kreider, JF., Rabl, A., (1994), Heating and cooling of buildings — design for efficiency, Singapore, McGraw-Hill, p1-14.
-
Lam, J., et al , (1997), Regression Analysis of High-rise Fully Air-conditioned Office Buildings, Energy and Buildings, 26(2), p189-197.
[https://doi.org/10.1016/S0378-7788(96)01034-1]
-
Lutton, L. Hyperex, (1995), A generic expert system to assist architects in the design of routine building types, Building and Environment, 30(2), p165-80.
[https://doi.org/10.1016/0360-1323(94)00048-W]
- Marszal, A.J., et al , (2011), Zero Energy Building – A review of definition and calculation methologies, Energy and Buildings, (43), p971-979.
-
Morel, N., Faist, A., (1993), Design tools for building thermal analyses: The significance of integration, Building and Environment, 28(4), p465-73.
[https://doi.org/10.1016/0360-1323(93)90023-V]
- M. Donn, et al , (2009), Simulation in the service of design–asking the right questions, in: Proceedings of IBPSA, Glasgow, p1314-1321.
- Meyer, WT., Energy economics and building design, New York, McGraw- Hill, (1983).
- Peterson, J.L., et al , (1989), The Correlation of Annula Commercial Building Coil Energy with Envelope, Internal Load, and Climatic Parameters, ASHRAE Transactions 95, Part 1.
-
Robert, D., and Henze, G., (2004), Statistical Analysis of Neural Networks as Applied to Building Energy Prediction, Journal of Solar Engineering, 126(1), p592-601.
[https://doi.org/10.1115/1.1637640]
- S. Attia, A. De Herde, (2011), Early design simulation tools for net zero energy buildings: a comparison of ten tools, in: International Building Performance Simulation Association, November 2011, Sydney, Australia.
- Seung-Bok, L., et al , (2005), An Energy Management Process and Prediction of Energy Use in Office Building, Journal of Asian Architecture and Building Engineering, 4(5), p501-508.
- Sodha, MS., et al , Solar passive building, Oxford, Pergamon Press, (1986).
- Soo-jin, K., (2011), A Study on Energy Saving Methodology in Office Buildings for Implementing ZEB(Zero Emission Building), Master’s Thesis, Chung-Ang University.
- Steffen, P., et al , (2010), Method and simulation program informed decisions in the early stages of building design, Energy and Buildings, (42), p1113-1119.
- Sullivan, R., et al , (1985), Commercial Building Energy Performance Analysis Using Multiple-Regression, ASHRAE Technical Data Bulletin.
- Todesco, G., Super-efficient buildings: how low can you go?, Refrigeration and Airconditioning, (1997), 38(12), p43-53.
- Wilcox, B.A., (1991), Development of the Envelope Load Equation of ASHRAE Standard 90.1, ASHRAE Transaction 97, Part 2.
-
Y.E. Kalay, (1999), Performance-based design, Automation in Construction, 8(4), p395-409.
[https://doi.org/10.1016/S0926-5805(98)00086-7]