The Analysis of Life Cycle Cost and Cooling Water Circulating Pump Energy Saving According to Variable Speed Pressure Differential Setpoint Control Strategy
ⓒ Copyright Korea Institute of Ecological Architecture and Environment
Abstract
The study applied control strategy to reduce through optimal control and operation of pump by applying control on variable speed to the circulation pump of HVAC system in the office building. The study has the purpose to review validity of control on variable speed as ESMs(Energy Saving Measures) and establish the control technology on variable speed pump. The study performed reduction analysis of building energy and economic evaluation of pump through energy effectiveness control strategy of HVAC system.
The study sought possible reduction through energy control strategy which can provide proper flow fitting to building load by applying control on variable speed pump. The study applied control strategy to reduce through pressure differential set-point control and operation of pump by applying control on variable speed to the circulation pump of HVAC system in the office building.
The results showed that about 16–35% of pump energy could be saved by using these optimal control strategies. In the result of analysis on 10 years life cycle cost of analysis on payback period of initial investment pump, variable speed pump control showed 5.1 years.
Keywords:
Variable speed pump, Variable frequency drives, Pressure differential setpoint, Life cycle cost, Building energy saving1. Introduction
1.1. Research background and objectives
According to the structure of national energy consumption, it is reported that energy consumption by building takes 25% up in total energy consumption. The government is providing various systems and laws to save energy by fundamentally changing building energy saving pattern to save energy used in building.
Energy used in thermal source and remission takes about 30% up of energy used in building among building energy making variable frequency drives that can reduce fan or pump power a way to conduct building energy saving efficiently. Widespread technologies of VFD have started to rapidly develop expanding its application field as the cost of VFD ( Variable Frequency Drives) gets lower. But problems regarding abstract control and optimized operation of CFD control keeps happening. Great endeavor is poured in the study that improves operation efficiency and optimum control technologies to solve this matters and optimized control algorithm about pump variable control is being studied to improve energy efficiency in field of building HVAC.
This study analyzed the power of heat sourc and cool water circulation pump saved using variable speed differential setpoint of circulation system of central heat source system which can supply desirable flow when load occurs building for national business and performed validity verification regarding variable speed control algorithm by comparing and analyzing heat source, cool water circulation pump power data in actuality of target buildings that above strategy is applied. Besides it also analyzed variable speed control strategies regardfing economics of pump and energy saving potential of buildings along with validity as building ESMs(Energy Saving Measures).
1.2. Contemplation of pilot studies
This study contemplation following pilot studies to analyze pump economics and power of heat source, cool water circulation depending on the methods of circulation pump shift control of HVAC system in domestic office buildings. A.M. Georgescu et.al1) studied methods to predict efficiency of variable speed circulation pump analyzing pump power saved through this. Zhenjun Ma et.al2) performed a study about saving rate of pump power presenting optimum control strategies about variable speed pump and structure of heating and cooling system. X.Q. Jin et al3) optimized control over cooling system and analyzed building energy consumption forming 3 energy saving strategies based on simulations by setting flow of circulation system as variable flow volume. Pemberton M et. al4) analyzed LCC and pump power saving rate according to control optimization and pump efficiency applied in the system by applying saving control strategies optimized. L.Lu et al5) analyzed energy saving rate of HVAC circulation system by pumping system control through optimization of differential pressure setpoint receiving information provided in system structure factors and as well analyzed the features of interaction between system components (cold water supply temperature, differential pressure sensor, temperature sensor) and system applied individually to minimize energy saving of circulation system.
This research analyzed the power of heat source and cold water circulation pump saved by applying variable speed control strategies of HVAC system in domestic office buildings based on the contents of pilot studies and verified validity of control algorithm and these control strategies by collecting power data of heat source and cold water circulation pump of actual buildings.
2. Interpretation model of simulation
2.1. Summary of target buildings and interpretation condition
The target model is F building located in Seoul, an office building with 10 stories above the ground, 3 stories below the ground. Design Builder 2.4 and EnergyPlus 8.1, active thermal interpretation program, were used to conduct modeling of this building and ESP Plus, Wincaps pump solution program were used for modeling of pumping system. Besides, automatic control of pump was produced and TwinCAT program which can apply, simulate PLC(Programble Logic Controller) was utilized. Input data of target buildings had its information input such as weather data of Seoul, exterior of building, lights, design condition of electric heater, factors of system (heat source system, air distribution system, resources of pumping system, system efficiency, system operation schedule, system efficiency curve). Data value presented as initial design value and actual value used in the buildings were put. Table 1 shows summary of building outline and facility system.
Information of factors needed inside the building (occupants, lighting devices, equipment) was put for internal heat amount generated. First, lighting and equipment determined the number and electricity capacity based on building design value of target building and the number of occupants were set as shown in Table 2. Table 3 shows outer temperature condition and energy consumption amount was interpreted using climate data of Seoul where target building is located. As objective data as possible is needed for input since energy that buildings save can be affected by very various factors. Thus, observation data by building operation and floor plan analysis of target buildings was applied as simulation input data. Data of efficiency breakdown by types at initial stage of building was applied in material property of wall, slave, roof, window which are building exterior conditions in this research and usage schedule information of equipment, lighting, working schedule and number of occupants of buildings that act as indoor load of the building was put as average input values referring to actual operation data. Table 4, 5 shows operation schedule and exterior condition of target buildings.

Overview of the target building and HVAC systems.
Design condition.
Outdoor temperature conditions.
Design condition.
Internal heat gain schedules.
2.2. Summary of HVAC circulation system
Figure 1 shows diagram of HVAC circulation system of target buildings. Cold water pipe of load side equipment is composed of variable flow system using two-way valve and made into a structure that can change the number of device operated by applying open and close vibration valve in front of cold water inlet of each heat source. Also, differential pressure sensor was applied in front and back of conditioning equipment at maximum distance where cold water flows. (Maintain the normal state by detecting differential pressure of terminal conditioning equipment at farmost distance from a machine room)

Variable speed pump control HVAC system diagram
2.3. Strategies of variable speed control of circulation pump
This research applied control strategies that can provide flow to deal with partial load by differently operating the number of pump rotations through variable speed control. Law of similarity of pump was applied to analyze pump power, pump flow, lift head of fluid and efficiency change of pump regarding control over number of pump rotations. The flow Q[m3/min] changes in proportion with the number of rotations and lift head H[h] changes in proportion with the square of number of rotations, with axial power P[rpm] changing in proportion with third power of number of rotations. Pump efficiency increases up to maximum level depending on the increase in number of pump rotations then decrease and lift head decreases after the maximum value with power gradually increasing. It is the rated speed of the cool water circulation pump of the building of the study 3570rpm, rated revolutions of cold water circulation pump of target buildings, maximum efficiency point exists in range of 30-50% of flow. Following shows relation between flow, lift head and axial power.
| (1) |
| (2) |
| (3) |
Q : volumetric flow rate [L/s]
N : shaft rotational speed [rpm]
H : pressure or head developed by the pump
P : shaft power [W]
This research used pump model polynomial of W.P Bahnfleth, E. Peyer6) to evaluate possibility of cold water circulation pump design and pump energy usage. Pump head and efficiency features were applied expanding operating point of variable speed pump by using pump law of similarity based on data of pump manufacturers. VFD set of variable speed pump motor is composed of pump efficiency(ηp ), motor efficiency(ηm ), VFD efficiency(ηυ ). Motor efficiency(ηm ) calculated demand quality of pump motor using equation(4), variable speed pump motor consumption (Wp ) calculated by applying flow, head, pump, motor, VFD efficiency values presented in Table 6 to equation (6).
Variable speed pump modeling performance data.
| (4) |
| (5) |
| (6) |
Mw : measured flow [L/s]
H : pump head [m]
ηυ,m,p : VFD, motor, pump efficiency [%]
SG : water specific gravity [kg/m3]
x : pump shaft horsepower [HP]
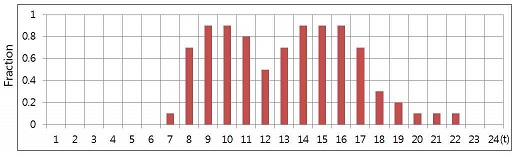
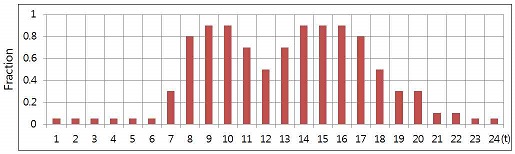
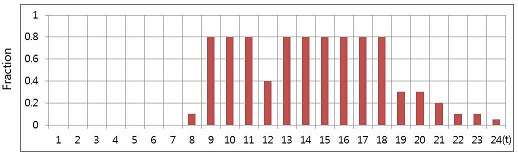
This research conducted modeling applying pump variable speed control like Figure1 through control strategies on differential setpoint to HVAC circulation system. Differential pressure controller is installed at return pimp of conditioning equipment at the terminal system and it is made so that control valve operates automatically as secondary change due to load change is provided as variable flow amount needed depending on the pressure change in upper and lower diaphragm after setting pressure according to differential pressure at supply and retrieval inside the pipe primarily through differential pressure control valve acknowledging it through tube pipe connected to supply pipe. Contents presented in ASHRAE Handbook-Applications7) was referred to for control algorithm of setpoint control and Figure 2 shows the procedures. OS (open signal) was determined thanks to over and below information of ε value (set as 2) set in this research using supplied air temperature information (Tsetpoint ) of conditional equipment and indoor air temperature (Tm ). Pressure and flow are decreased by reducing the number of motor rotations of pump to maintain set differential pressure (PDset, I)
inside the system when open signal becomes below 70% and in comparison, differential setpoint optimum care was done to constantly maintain the set differential pressure by increasing pressure and flow and number of pump motor rotations when open signal exceeds 90%. Average change ratio of flow control valve open and average change ratio of differential ratio because of it according to the change in load in summer of simulation in accordance with procedures of algorithm were calculated through simulation calculations and Figure 3 shows the graph of its result values. It was analyzed that open signal of flow control valve and average change ratio of differential pressure setpoint are controlled between 100-200kPa of setting value of differential pressure and 60-70% of open signal to deal with partial load in case of middle term (May, October) and controlled between 250-400kPa of setting value of differential pressure and 70-90% of open signal to deal with partial load and full load in case of summer (June-September). Thus pump energy was saved because of reduced flow resistance of system through differential pressure setpoint control and pump and heat source power was saved as well dealing with partial load by carrying out setpoint control of differential pressure through information of flow control valve open.

The pressure differential set-point optimizer.

Changing of the △p & biggest openness valve position OSmax.
2.4. Simulation model modification and validity verification
This research compared modified simulation result value to the result data of heat remission and source pump power of actual buildings where control strategic models were applied to verify the validity and modification of modeling of variable speed control strategy of circulation pump conducted in this research. Input value as well was modified by analyzing the causes of error when errors of actual energy consumption and simulation energy consumption are frequent through model verification procedures. Heat source and remission power were compared with yearly consumption and monthly consumption then error rate is analyzed, conducting modeling modification work analyzing error rate using modification equation of monthly data of M&V Guidelines.
Error calculation used MBE (Mean Bias Error, equation(7)), coefficient of variation(Cv(RMSE), Coefficient of Variation of Root Mean Square Error), equation (10)). Table 7 shows allowed range of MBE, Cv(RMSE), which are below ±5%, 15% monthly each. Table 8 shows calculation result and errors.
Acceptable Calibration Tolerances.
Calculations to determine monthly model calibration.
| (7) |
| (8) |
| (9) |
| (10) |
Smonth : simulated energy consumption [kWh]
Mmonth : measured energy consumption [kWh]
A : mean of the measured energy consumption [kWh]
3. Analysis result
This research analyzed the power of cool water circulation pump saved by applying control over number of rotations of circulation pump according to setpoint strategies of differential pressure of pump through number calculation and simulation. The degree of relative consumption power change of pumping system and efficiency depending on the changes in the number of pump rotations was estimated by applying pump law of similarity and it was verified that it is efficient energy saving factor of variable speed control of pump through data, information of head and power consumption, rotation speed (rpm), pump flow. Table 9 shows comparison of power consumption of cold water circulation on average of summer depending on control strategies of setpoint control of differential pressure. Equation (6) was used to calculate pump power by applying control over the number of pump rotations by load rate through induction of average load rate of summer (June~ September) and spring and fall (May, October) that use cold water supply for building cooling. It was calculated that about 35.3% of power is saved as a result of comparing expected pump consumption of control over the number of pump rotations through differential pressure setpoint strategy and Non-VFD by average load rate by time through average valve open signal information during working hours (7am-20pm) of seasons. Summer showed about 16.8% saved pump power. Spring and fall did not show big effect from the result of comparison to Non-VFD since pump is usually fully operated in the period of peak load in case of summer while reduction rate is high because of many numbers of pump rotations due to long partial load compared to summer. This result predicted pump reduction rate using ESP Plus, Wincaps that are pump solution and number calculation of pure pump power of cold water circulation and heat source, remission power was analyzed to be 19.5% of reduction rate with 13,060.2 kWh where about 3,170 kWh is reduced compared to the state before variable speed control application when there is control linked to HVAC system and pump control upon performing control over the number of pump rotations applying setpoint control strategies of differential pressure presented in About 20% of energy saving effect exists when setpoint control of differential pressure but reduction amount was shown less compared to other pilot studies. The reason for it is design flow condition is not accurately designed although design flow is made to be provided inside the circulation system by maintaining primary side pressure balance of flow distribution system where flow changes through setpoint control of variable speed differential pressure. Thus differential pressure of back and front flow control valve increased because it is not ideally controlled due to imbalance in setting point of pressure inside the system. It is considered that there has been power waste since extreme pump control has been carried out than the needed flow due to increase in differential pressure and reduction rate of pump power of heat source and cold water circulation was not drawn exactly. Thus it is planned to realize the module that prevents unnecessary operation of pump by keeping initial differential pressure steadily always maintaining normal operation state despite the shifts in pressure at front and back of side primary flow control valve of pumping system by modifying setting point of pressure and applying PDCV (Pressure Differential Control Valves) additionally on the valve of flow control for future studies.
Comparison of the average pump power difference according to the VFD application.
4. Analysis of pump economics
4.1. Cost calculation of pump lifecycle
Lifecycle cost of pump refers to the cost generated during its lifespan from purchase to installment, operation, maintenance and waste disposal. Cost calculation of pump lifecycle decided resource, price of pump using data from cost guidelines for pump system lifecycle of hydraulics made by energy department of United States and pump companies in Europe applied in pump solution(Wincaps, ESP Plus)8 ) and calculated using equation of lifecycle cost. Pump system of VFD application had its lifecycle cost of pump system calculated dividing it into items such as average consumption, operating hours, operating period, initial investment in pump, maintenance cost, energy cost regarding cold water circulation pump parts of HVAC system. Table 10 shows items of lifecycle cost done in this study.
① Items of average consumed power was analyzed with kWh, energy usage per unit area. ② Daily operating hours of pump were calculated applying 12-hour schedule approximately ③ and operating period was calculating after being set as 145 days except holidays, mondays in number of days from May to October when cold water supply is used. ④ Period of cost calculation of pump lifecycle was based on 10 ears ⑤ and total energy consumption was calculated by multiplying 10 years which is calculating period of lifecycle, number of days, operating hours used for pump operation. ⑥ Lifecycle was calculated by calculating electricity cost of summer of choice 1, general electricity high pressure as an average value after April first in 2015. ⑦ Installment cost of pump was calculated based on data provided for G pump company and pump price presented in Wincaps, ESP Plus, which are pump solutions. ⑧ Maintenance cost was calculated based on contents presented in guidelines of Pump Life Cycle Cost of pump system by America hydaulics. Finally, ⑨ energy cost was calculated as the value that total energy consumption is multiplied with electricity cost. Lifecycle cost of pump is composed of factors below and LCC is as same as equation below(11).
| (11) |
Cic : initial costs, purchase price(pump, system, pipe)
C∈ : installation and commissioning cost
Ce : energy cost
Co : operation costs
Cm : maintenance and repair costs
Cs : down time costs
Cenυ : environmental costs
Cd : decommissioning/disposal costs
Comparison of Life cycle cost
Table 11 shows installment cost and retrieval period of LCC10 cold water circulation pump of setpoint strategies of differential pressure of variable speed control and Non-VFD system of HVAC water pipe system conducted in this research. It was analyzed that about 7,800,000 won is saved in lifecycle of variable speed control strategies compared to Non-VFD as energy cost through pump operation decreases as a result of considering total lifecycle cost of LCC10 although maintenance cost and initial investment of differential pressure setpoint control strategies of variable speed are high compared to that of Non-VFD. Thanks to this result, it was analyzed the investment can be retrieve within about 5.1 years when variable speed control strategies of circulation pump are applied.
Comparison pump LCC10 & payout time.
5. Conclusion
This research predicted energy consumption generated through control over the number of pump rotations and analyzed circulation pump power of heat source and cold water saved applying setpoint control strategies of variable speed of cold water circulation pump of HVAC system. Then it analyzed economics of LCC10 of pump and verified validity regarding algorithm of variable speed control of this research by comparing and analyzing power data of circulation pump of actual heat source and cold water of target buildings. Followings are research results.
(1) About 16.8% in summer, 35.3% in spring and fall was saved as a result of comparing pump consumption performing control over the number of pump rotations by applying setpoint control strategies of variable speed differential pressure. Also it was analyzed about 19.5% of pump power of heat source and cold water is saved when there was control linked to HVAC system.
(2) About 7,800,000 won was saved as a result of analyzing LCC10 by comparing yearly energy consumption and initial investment of setpoint control strategies of differential pressure and the case of Non-VFD and the retrieval period for intial investment was analyzed to be 5.1years. Thus, setpoint control of differential pressure is considered to be proper for economic design methods.
Setpoint control strategies of differential pressure which is variable speed control of circulation pump of HVAC system was determined as an efficient energy factors that can save building energy.
A future study to solve problems that keeps happening because of increase in differential pressure at back and front of side flow control valve of setpont control system of differential pressure is to be carried out for follow-up.
Acknowledgments
"This work was supported by the National Research Foundation of Korea(NRF) grant funded by the Korea government(MSIP) (No. 2011-0028075)."
Reference
-
A.-M. Georgescu, C.-I. Cosoiu, S. Perju, S.-C. Georgescu, L. Hasegan, A. Anton, “Estimation of the Efficiency for Variable Speed Pumps in EPANET Compared with Experimental Data”, Procedia Engineering, 89, (2014).
[https://doi.org/10.1016/j.proeng.2014.11.466]

- Zhenjun Ma, Shengwei Wang, “Energy efficient control of variable speed pumps in complex building central air-conditioning systems”, Energy and Buildings, 41, (2009).
-
Xinqiao Jin, Zhimin Du, Xiaokun Xiao, “Energy evaluation of optimal control strategies for central VWV chiller systems”, Applied Thermal Engineering, 27, (2007).
[https://doi.org/10.1016/j.applthermaleng.2006.08.015]
- Mike Pemberton, “Strategies to Improve Pump Efficiency and Life Cycle Performance”, World Pumps, (2005).
- Lu Lu, Wenjian Cai, Lihua Xie, Shujiang Li, Yeng Chai Soh, “HVAC system optimization—in-building section”, Energy and Buildings, 37, (2005).
- ASHRAE Handbook—HVAC Applications, American Society of Heating, Refrigerating and Air-Conditioning Engineers, Inc., Atlanta, 41, (2011).
-
김서훈, 곽노열, “변속 펌프의 에너지 효율 제어를 통한 HVAC 수배관 시스템의 에너지 절감”, 대한건축학회논문집, 28(2), (2012).
Seo-Hoon Kim, Ro-Yeul Kwak, “Evaluation of Energy Savings Applying Energy Efficient Control ofVariable Speed Pump in HVAC Hydronic Systems”, journal of AIK, 28(2), (2012). - J.B. Rishel, Wire-to-water efficiency of pumping systems, ASHRAE Journal, 43, p40-46, (2001).
- James B. Rishel, Wire-to-Water Efficiency Of Pumping Systems, ASHRAE Journal Pumps, (2001).
- Office of Industrial Technologies Energy Efficiency and Renewable Energy U.S. Department of Energy, Pump Life Cycle Costs : A Guide to LCC analysis for Pumping Systems, (2001).
- Lal, Jayamaha Dr., Energy-Efficient Building Systems, p114-116, (2007).
- Thinking Building Universe Grunfos Commercial Building Services, (2011).