A Comparative Analysis of Heatwave Vulnerable Regions using Heat Index Frequency, Heat-related Mortality and Heatwave Vulnerability Assessment
ⓒ 2021. KIEAE all rights reserved.
Abstract
In this study, based on the disaster vulnerability analysis manual, the heatwave vulnerability of Daegu Metropolitan City, South Korea, is evaluated by administrative districts, and the characteristics of each detailed spatial region within the city are analyzed.
A comparative analysis is performed with the results of the vulnerability analysis by introducing the frequency analysis of the heat index (HI), an index indicating the degree of heat felt by humans, and an analysis of the heat-related mortality index indicating the damage caused by heatwaves. For a comparative analysis of the three analysis results, a four-level-based distribution map was created for each analysis result by dividing the results into four levels using Jenk’s natural classification method in QGIS.
As a result of a comparative analysis, the results of vulnerability analysis rather than the HI frequency analysis showed a relatively more similar distribution to heat-related mortality. Likewise, in the Pearson correlation analysis conducted for quantitative verification, the vulnerability analysis result showed the highest positive correlation with the mortality analysis result. The results show that a more comprehensive plan is needed to analyze various components, such as citizens, infrastructure, and buildings, by spatial area in the city to construct a more realistic response system to heatwaves. This study shows the importance of examining the regional and spatial characteristics within a city and confirms the need to accurately diagnose the cause of heatwaves and prepare appropriate mid- to long-term planning and policy establishment processes accordingly.
Keywords:
Climate Change, Heatwave, Vulnerability, Heat Index, Heat Related Mortality키워드:
기후변화, 폭염, 취약성, 열파지수, 온열질환 사망자수1. Introduction
In recent years, the frequency of natural disasters has become increasingly serious due to climate change. In particular, extreme climate events occur due to urban warming, which leads to a gradual increase in the intensity and frequency of heatwaves[1][2]. In addition, heatwaves generally cause more casualties than physical facility damage or property damage among meteorological disasters and record a higher death rate than typhoon floods[3]. In the case of Korea, according to the Climate Change Prospect Report (2020), the average annual temperature will gradually increase in the next century from 2021 to 2100, and the average annual temperature in the second half of the future from 2081 to 2100 is expected to rise by +2.6-7.0℃. A preemptive response is required to reflect the trend of this heatwave phenomenon, and efforts to respond are emphasized[4].
According to the sixth report of the Intergovernmental Panel on Climate Change (IPCC), the surface temperature in the last 40 years since 1850 has been reported to be higher than any decade in the past[5]. The seriousness of the impact of climate change is well-known, and much effort is being made to evaluate the impact of expected climate change in advance and to establish appropriate countermeasures and adaptation measures[6].
Korea also recognized the seriousness of climate change and adopted an urban climate change disaster vulnerability analysis in 2012 by revising urban planning guidelines for effective response[7]. In Korea, the Ministry of Land, Infrastructure and Transport and the Korea Research Institute for Human Settlements have produced and distributed the Manual for Urban Climate Change Disaster Vulnerability Analysis (2013)」and「Guidelines for Urban Climate Change Disaster Vulnerability Analysis and Utilization (2016)」to support the rapid settlement and education of such vulnerability analysis[8]. These disaster vulnerability analysis manuals and usage guidelines in Korea have been utilized in various studies[4][9][10].
However, few studies have conducted comparative analysis with the results of vulnerability analysis by examining the effects of heat that people feel and the damage caused by the extreme thermal environment. Since climate change disasters have very high uncertainty, it is an important issue to continuously supplement response strategies by analyzing the spatial distribution pattern and characteristics while monitoring the change trend[10].
Therefore, in this study, the vulnerability to heatwaves caused by climate change, the frequency of the heat index, and the number of heat-related deaths were comprehensively analyzed and compared in space. First, the spatial distribution was compared by analyzing the frequency of the heat index, which is an indicator of the heat felt by people, and evaluating the vulnerability to heatwaves that encompass all human, economic, and social indicators. Second, the previous two analysis results were compared with the heat-related mortality rate, and the degree of similarity with the distribution of human casualties due to heat was identified. The results of this study can be utilized later when preparing strategies for adaptation and response to heatwaves reflecting regional characteristics. In addition, it is expected that the analytic framework of this study will be able to contribute a foundation for establishing a regionally differentiated thermal environment improvement policy by conducting an analysis in units of administrative districts.
2. Literature Review and Theoretical Considerations
2.1 Climate change vulnerability assessment
Studies have been conducted using Korea's legal-based disaster vulnerability analysis guidelines[9][10][11][12]. Kim et al.[11] compared the degree of disaster vulnerability among urban areas, declining areas, and urban regeneration project areas nationwide and reviewed which disasters the declining areas are vulnerable to. To this end, they analyzed indicators related to heavy rain, heatwaves, and earthquakes specified in the disaster vulnerability analysis guidelines and identified the spatial distribution of disaster vulnerability at a specific site. Lee et al.[10] compared vulnerability analysis and risk assessment methods for recent urban planning establishments, including floods, which are major natural disasters, and compared the evaluation results. Kim & Eum[12] selected a thermal vulnerability evaluation index based on thermal vulnerability analysis guidelines linked to a policy to efficiently improve the thermal environment. Hong et al.[9] derived the evaluation results when spatial units were subdivided by supplementing, comparing, and reviewing the urban climate change disaster vulnerability analysis guideline, which is the current aggregate district unit analysis method, with a grid unit analysis technique.
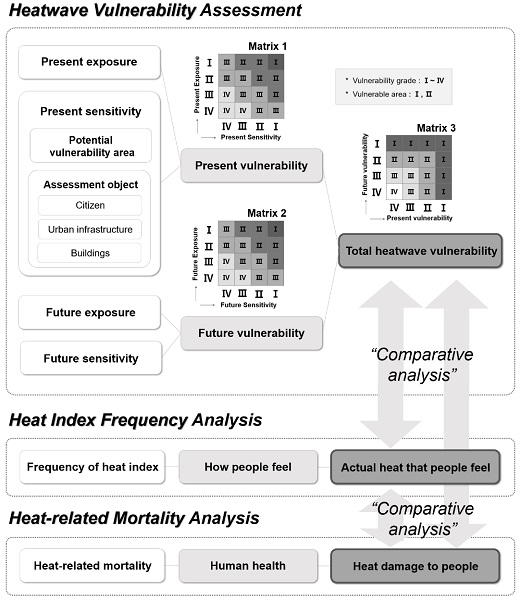
According to previous research reviews, the spatial distribution of disaster vulnerability in a specific site was identified, and particular vulnerable areas were derived by using Korean policy-based vulnerability analysis guidelines. However, few studies have considered the results of comprehensive comparative analysis, including the effects of heat that people feel and the damage that people experience due to extreme thermal environments in the scope of the study. We derived consideration and implications for the improvement of the vulnerability assessment methodology by conducting a comprehensive comparative analysis with the degree of heat felt by people in a city and health-related casualty data (see Fig. 1.).
2.2. The degree of heat that a person feels: heat index
The heatwave index was originally developed by Steadman[13] as an index that requires the solution of several variables within some equations expressed as heat and water transfer in the body, which is not easily available[14]. HI has been defined as a cognitive temperature index that expresses the heat that a person feels and has been used in several studies[15][16]. As such, the heat index is a variable representing the heat that a person feels according to temperature (t) and humidity (r) and is calculated as follows[17]:
| (Eq. 1) |
To understand the degree of heat that a person feels, we used the standard of response guidelines for each grade of HI provided by the Korea Meteorological Administration (KMA) (see Table 1.). First, among the five grades in Table 1., we derived the sum of the frequencies for each administrative dong unit for the four levels of ‘Medium’, ‘High’, ‘Very high’, and ‘Danger’, which require health considerations. Therefore, in this study, we analyzed the frequency of each administrative ‘dong’ unit for the four stages of ‘Medium’, ‘High’, ‘Very high’, and ‘Danger’ and used it as a comparison target with the vulnerability assessment results.
2.3. Heat-related mortality
Several types of mortality are indicators of injuries caused by heatwaves, among which cardiovascular disease occupies a particularly large proportion of the injuries[18][19]. Therefore, in this study, mortality from hypertensive disease, ischemic heart disease, other heart diseases, and cerebrovascular diseases, which are subtypes of cardiovascular disease, were utilized as an index to analyze the degree of heat-related mortality.
3. Research Scope and Methods
3.1. Research scope
We selected Daegu Metropolitan City, a representative city that reports the most severe heat damage every year in Korea, as the test site, and the unit of analysis was set as the administrative district. In 2018, the highest temperature was recorded and had the longest duration for all recorded temperatures[20]. Accordingly, we decided that 2018 would be the time scope of the present sector among the analysis targets. Starting in2018, data from the past 10 years and future climate change scenario (RCP 8.5) data were comprehensively used to infer future changes, and through this, data for the future sector of vulnerability assessment were constructed.
3.2. Research methods
In the climate change disaster vulnerability analysis (Fig. 3.), the vulnerability of cities for climate change disasters is largely divided into present vulnerability, future vulnerability, and total disaster vulnerability. The present and future vulnerabilities consist of the climate exposure sector and the urban sensitivity sector comprising various elements of citizens, urban infrastructure, and buildings.
To perform a direct comparison between analysis indicators of different scales, the method based on the normal distribution was used. It is a number that can confirm how far the measured value is from the mean based on the standard deviation and is calculated using (Eq. 2).
| (Eq. 2) |
Here, Xi is the measured value of the analysis index X of i for each area, Xmean is the average of the analysis index X for each area, and XStd is the standard deviation of the analysis index X for each area.
By calculating the standardization index for each analysis index, the scores for each sector (present climate exposure, future climate exposure, present sensitivity, future city sensitivity) were calculated. The standardized index (ZscoreNormal) is a value obtained by converting the Zscore value, which ranges from negative to positive, into a value between 0 and 1, and is calculated by (Eq. 3).
| (Eq. 3) |
At this time, a and b were calculated as (Eq. 4) and (Eq. 5), respectively.
| (Eq. 4) |
| (Eq. 5) |
where, Zscoremaxis the maximum value among the Zscore of the entire area and Zscoreminis the minimum value among the Zscore of the entire area. The standardization index for each analysis index was calculated according to the vulnerability analysis structure to calculate the present climate exposure, present urban sensitivity, future climate exposure, and future urban sensitivity scores. Afterward, the average of the standardized index of n indicators for each sector (present exposure, present sensitivity, future exposure, future sensitivity) was calculated by the following this equation:
| (Eq. 6) |
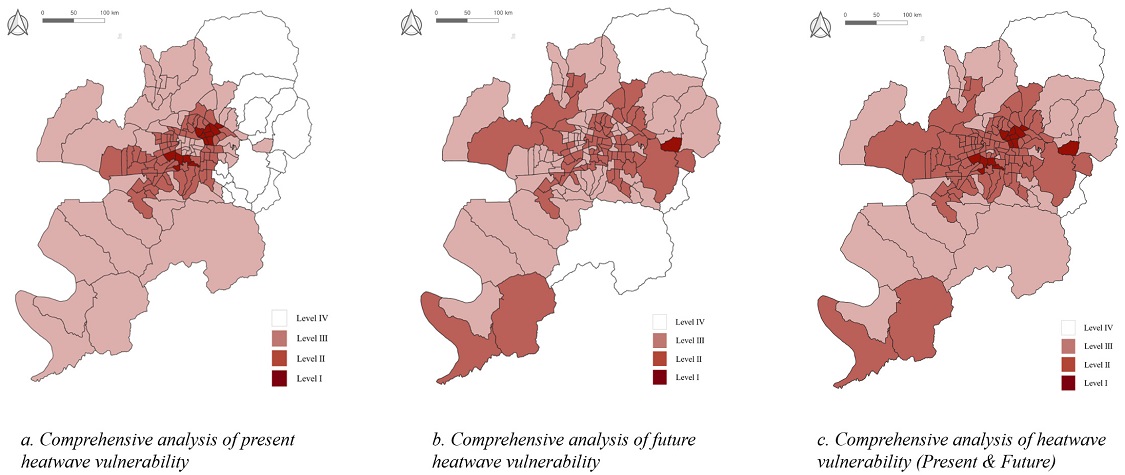
Using the natural classification method (Jenks' optimization method), which is the classification method of the grade section of the geographic information system (GIS) program, the vulnerability analysis value is graded I-IV (the most vulnerable as the grade goes to the grade I, where I and II are defined as vulnerable regions in the manual) to confirm the distribution of the degree of vulnerability for each administrative ‘dong’ unit. The present vulnerability analysis was derived by superimposing the present climate exposure class and the present urban sensitivity class using Matrix 1 in Fig. 1. Similarly, the future vulnerability analysis was derived by superimposing the future climate exposure class and the future urban sensitivity class using Matrix 2 in Fig. 1. Finally, Fig. 2c. shows the urban comprehensive disaster vulnerability derived by superimposing the present vulnerability analysis result and the future vulnerability analysis result through Matrix 3 in Fig. 1. As shown in Fig. 2, the present, future, and urban comprehensive disaster vulnerability were created as a result of overlap in grades I-IV. Grade I is the most vulnerable area to disaster, and disaster-vulnerable areas are in grades I and II.
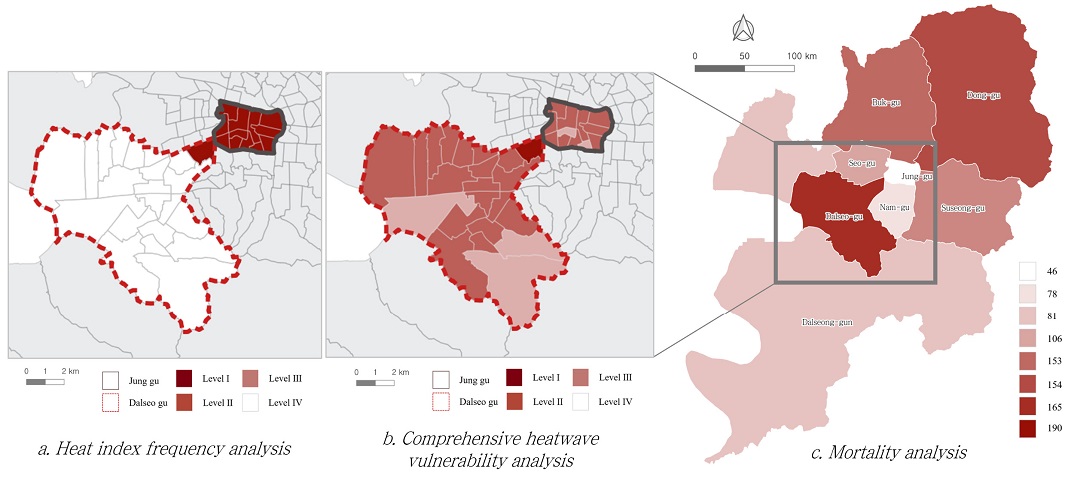
As with the vulnerability assessment method, we performed spatial analysis by collecting HI frequency and heat-related mortality data for each administrative district in Daegu. In the case of HI frequency, it was possible to collect data in 139 administrative 'dong' units, but in the case of death data available in Korea, it was a more macroscopic unit of ward data. Therefore, when performing a comprehensive comparison of three areas, heatwave vulnerability, HI, and heat-related mortality, which is the final process, the spatial units of data were unified and analyzed in ward units (see Fig. 5.). For effective comparison and analysis under the same classification conditions as the heatwave vulnerability evaluation result, the Jenks natural classification method was used to classify the same into grades I to IV. The distribution values of levels in each result map are scores calculated by Eqs. (3) to (6), and each value is dimensionless.
4. Results
4.1. Heatwave vulnerability assessment
By overlapping the present vulnerability analysis results and future vulnerability analysis results to comprehensively consider vulnerabilities, a long-term comprehensive vulnerability assessment and relative comparison between detailed regions within Daegu City were performed. Fig. 2c. illustrates the total heatwave vulnerability derived by comprehensively considering both the present vulnerability in Fig. 2a. and the future vulnerability in Fig. 2b.
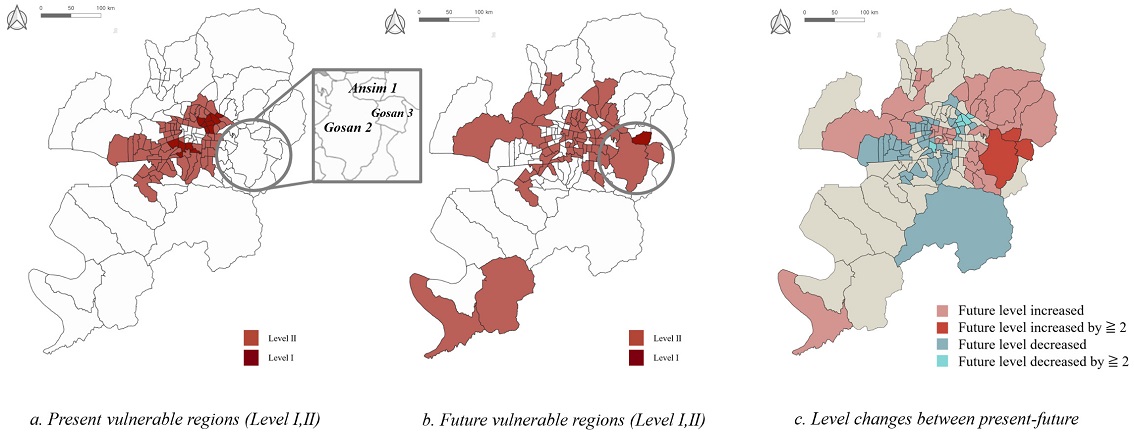
A detailed analysis was carried out to identify trends of change between present and future sectors (see Fig. 3.). According to the analysis results, there were 36 ‘dong’ areas where the level increased in the future compared to the present and 50 dong areas where the level decreased. ’Dong’ is an administrative unit at the municipal level of a city in Korea.” Based on these results it was possible to derive the spatial distribution of regions showing different trends in the degree of vulnerability between the present and the future (Fig. 3c.).
In particular, the results obtained by extracting and comparing only the vulnerable areas (Level I, II) are shown in Fig. 3a. and 3b. Although not identified as a vulnerable area at present, three areas were predicted to be vulnerable in the future: Ansim 1-dong, Gosan 2-dong, and Gosan 3-dong. These three regions are regions where future development projects are planned, and the relatively large vulnerability of the future sector is considered.
4.2. Results of heat index frequency analysis
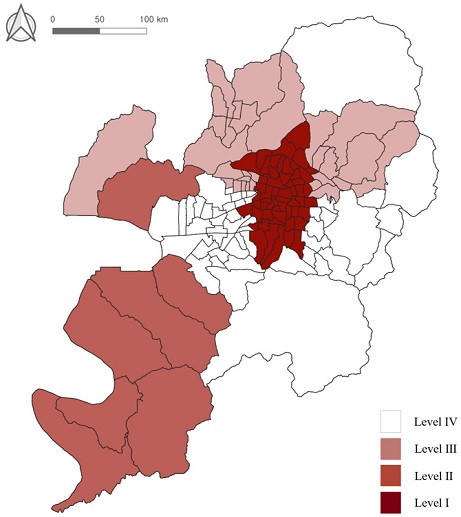
We constructed HI data by using (Eq. 1) with air temperature and humidity data from KMA's 2018 weather data. We calculated the frequency of each HI level for each 139 administrative dong unit with a QGIS tool. The total frequency of each administrative dong unit was classified into four stages according to Jenks' natural classification method, and the visualized map is shown in Fig. 4. According to HI levels in Table 1., Fig. 4. illustrates the distribution values of levels that explain the number of occurrences of ‘Medium’ and higher levels in each spatial region. The value of each level is counts per unit ‘dong’. According to the distribution, the inland area of the city was confirmed to have the highest HI distribution: Level I.
4.3. Results of heat-related mortality analysis
As a result of the analysis of heat-related mortality, it was confirmed that the mortality of the elderly (65 years and older) compared to the mortality of all age groups was significantly higher (see Table 3.). In particular, the Dalseo-gu area was identified to have the most casualties, and the Jung-gu area was identified to have the fewest casualties. We further analyzed the changes between 2008 and 2018 to estimate the number of human casualties that will change. When calculating the trend of heat-related mortality over the past ten years, Dalseo-gu showed the largest increase, suggesting that vulnerability in the future health sector could increase at a relatively larger rate.
5. Discussion and Conclusion
This study was conducted as a basic study to diagnose the vulnerability of cities due to heatwaves and support an indicator-based response strategy for Daegu City. We ultimately suggested several implications by comparing the vulnerability analysis results with two additional analyses: HI frequency analysis and heat-related mortality analysis. By comparing the results of heatwave vulnerability analysis and HI frequency for 139 administrative dong regions in Daegu City, the spatial characteristics of the regions were analyzed, and implications were derived from them. The HI, which we have introduced as an additional indicator of analysis, is known as a measure of the human body's ability to rude heat or as a measure of the stress imposed on humans by high levels of atmospheric conditions[21]. It has been reported that elevated levels of HI result in adverse human health consequences and that high levels of HI maintained over long periods of time may pose a generally greater risk to the public health sector[22]. As such, the HI is an index closely related to human health and has been used in studies to estimate the degree of extreme heat and various heatwave vulnerable areas[22][23][24]. However, there have been few attempts to comparatively analyze the frequency of HI at a level that could harm humans. Therefore, we analyzed a new HI frequency index and compared the differences in their distribution with the heatwave vulnerability results in the detailed administrative dong unit within Daegu City. To assess the damage that the two analyses (heatwave vulnerability, HI frequency) have to human health, the spatial trend of heat-related mortality was also analyzed (See Fig. 5.). Comparative analysis of HI frequency and heatwave vulnerability results in the Dalseo-gu regions of Fig. 5a., b. had the most different distribution between the two analysis results. The result of HI frequency analysis in Dalseo-gu (Fig. 6a.) identified IV, the lowest level in most regions, but the result of the heatwave vulnerability analysis (Fig. 5b.) identified vulnerable levels I and II in regions. In Jung-gu, while the HI frequency analysis identified that all regions were at the level I, the most hazard area, the vulnerability analysis identified that some regions were at the levels Ⅱ and Ⅲ, somewhat lower risk. As a result of comparison and analysis with heat-related mortality for these two regions (Fig. 5c.), the results in Dalseo-gu showed higher relationship between heatwave vulnerability and mortality analyses and the results in Jung-gu rarely showed their relationship. Because the indicators of citizens, infrastructure, and buildings are different between each spatial region and the HI frequency analysis does not include those indicators, the risk grade according to the HI frequency index hardly reflect the characteristics of each spatial region.
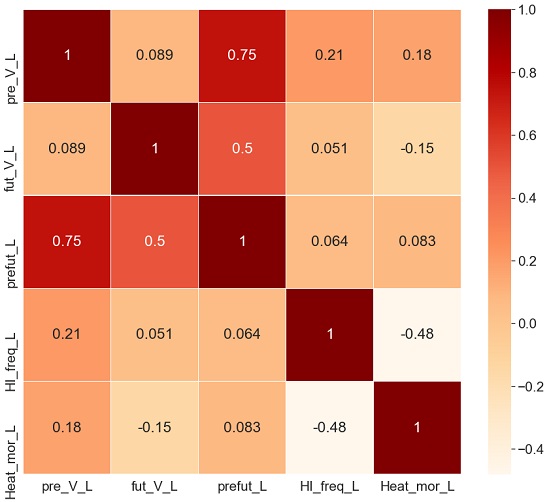
Correlation results of 3 analysis Vulnerability, HI frequency, Mortality. pre_V_L, present vulnerability level; fut_V_L, future vulnerability level; prefut_L, Total vulnerability level; HI_freq_L, HI frequency level; Heat_mor_L, mortality level
Additional analysis was performed by applying the Pearson correlation method to derive a statistical comparative correlation between the three analysis results: heatwave vulnerability, HI frequency, and heat-related mortality. All the results derived from each analysis were classified into four levels (Ⅰ~IV) according to the Jenks natural classification method, and correlation analysis was performed. As a result of the analysis (see Fig. 6.), it was concluded that the index showing the highest positive correlation with the heat-related mortality level (Heat_mor_L), which is an index indicating the direct damage of heatwaves to humans, was the present vulnerability level (pre_V_L). Through this, it was confirmed that the HI, which is used as a standard as a countermeasure for the health sector in Korea, may have a limit to directly inferring the damage to citizens in specific regions. The urban heat island phenomenon mainly occurred in a local administrative region, i.e. dong with a high proportion of the vulnerable population in Seoul, South Korea[25], and the ratio of recipients of basic livelihoods and the ratio of the elderly living alone were significant variables to examine areas vulnerable to heat environments by logistic regression analysis considering population and socioeconomic characteristics[26]. Poverty and building conditions were also significant elements explaining the distribution of heat vulnerability[27]. According to the high correlation with heat-related mortality in this study, a comprehensive analysis with various factors in a city were valid to analyze heat vulnerability. Additionally, the present vulnerability sector (pre_V_L) that considered the urban composition indicators of various sensitivity areas in the city showed a greater correlation with the mortality rate than the future vulnerability sector (fut_V_L). Therefore, to effectively respond to the vulnerability of the public health sector due to climate change disasters that vary by region, urban planners need to comprehensively consider the local climate, land use, citizens, and infrastructure based on a detailed regional disaster vulnerability assessment.
In this study, we experimented with short-term data due to time and labor limitations. In the future, it will be necessary to experiment with more diverse indicators and long-term data. The methodology and results of this study can be utilized as basic research in the development of a spatial indicator-based response system in the field of heatwave vulnerability.
Acknowledgments
This work is supported by the Korea Agency for Infrastructure Technology Advancement (KAIA) grant funded by the Ministry of Land, Infrastructure and Transport of Korea (21NSPS-C149830-04).
References
-
G. Yang et al., How can urban blue-green space be planned for climate adaption in high-latitude cities? A seasonal perspective, Sustainable Cities and Society, 53, 2020, 101932.
[https://doi.org/10.1016/j.scs.2019.101932]

-
J. A. F. van Loenhout et al., Heatwave preparedness in urban Georgia: A street survey in three cities, Sustainable Cities and Society, 70, 2021, 102933.
[https://doi.org/10.1016/j.scs.2021.102933]

-
구유성 외 3인, 폭염 취약성평가를 통한 도시의 적응능력 향상: 부산광역시를 중심으로, 한국지역개발학회지, 제27권 제5호, 2015, pp.331–347.
Y.S. Koo et al., Study on the Improvement of Adaptation Ability by Vulnerability Analysis of Heat Wave - the Case of Busan Metropolitan City, Journal of The Korean Regional Development Association, 27(5), 2015, pp.331–347. -
김지숙, 김호용, Landsat 8 영상과 취약성 분석을 활용한 폭염재해 취약지역의 특성분석, 한국지리정보학회지, 제23권 제1호, 2020, pp.1–14.
J.S. Kim, H.Y. Kim, Analysis on the Characteristics of Heat Wave Vulnerable Areas Using Landsat 8 Data and Vulnerability Assessment Analysis, Journal of the Korean Association of Geographic Information Studies, 23(1), 2020, pp.1–14. - R. P. Allan et al.. Climate Change 2021: The Physical Science Basis - Summary for policymakers, IPCC, 2021, pp.1-42.
-
최현아 외 5인, 시.공간정보기반 기후변화 취약성 평가, 한국공간정보시스템학회 논문지, 제11권 제3호, 2009, pp.63–69.
H.A. Choi et al., Climate Change Vulnerability Assessment Based on Spatio-Temporal Information, Journal of Korea Spatial Information System Society, 11(3), 2009, pp.63–69. -
김지숙, 김호용, 도시 기후변화 재해취약성 분석방법의 가중치 조정에 따른 결과 비교 검토 - 해수면 상승 재해를 중심으로, 환경영향평가, 제26권 제3호, 2017, pp.171–180.
J.S Kim, H.Y. Kim, A Review on the Results of Adjusting Weight in Vulnerability Analysis of Climate Change Driven Disaster - Focused on Sea-level Rise -, Journal of Environmental Impact Assessment, 26(3), 2017, pp.171–180. -
이상혁, 강정은, 도시계획 적용을 위한 도시홍수 취약성 및 리스크 평가, 대한국토 · 도시계획학회, 제53권 제5호, 2018, pp.185–206.
S.H. Lee, J. E. Kang, Urban Flood Vulnerability and Risk Assessments for Applying to Urban Planning, Journal of Korea Planning Association, 53(5), 2018, pp.185–206. [https://doi.org/10.17208/jkpa.2018.10.53.5.185]
-
홍재주 외 3인, 격자단위 분석기법을 적용한 도시 기후변화 재해취약성분석, 대한공간정보학회, 제23권 제6호, 2015, pp.67–75.
J.J. Hong, et al., Grid Unit Based Analysis of Climate Change Driven Disaster Vulnerability in Urban Area, Journal of Korea Spatial Information Society, 23(6), 2015, pp.67–75. [https://doi.org/10.12672/ksis.2015.23.6.067]
-
이병재, 김학열, 김소윤, 기후변화 홍수에 대한 국토 취약성 변화 분석 연구, 한국방재학회논문집, 제18권 제6호, 2018, pp.27–33.
B.J. Lee, H.Y. Kim, S.Y. Kim, Changes in Climate Change Flood Vulnerability for National Territories, Journal of the Korean Society of Hazard Mitigation, 18(6), 2018, pp.27–33. [https://doi.org/10.9798/KOSHAM.2018.18.6.27]
-
김지영 외 3인, 쇠퇴지역과 도시지역의 재난 취약요인 비교·분석, 디지털콘텐츠학회논문집, 제21권 제11호, 2020, pp.2021–2032.
J.Y. Kim et al., A Comparative Analysis of Disaster Vulnerability Factors between Declining Areas and Urban Areas, Journal of Digital Contents Society, 21(11), 2020, pp.2021–2032. [https://doi.org/10.9728/dcs.2020.21.11.2021]
-
김권, 엄정희, 열취약성 평가를 통한 열환경 개선 정책 제시 - 대구광역시를 사례로 -, 한국지리정보학회지, 제21권 제2호, 2018, pp.1–23.
K. Kim, J.H. Eum, Policies for Improving Thermal Environment Using Vulnerability Assessment - A Case Study of Daegu, Korea -, Journal of the Korean Association of Geographic Information Studies, 21(2), 2018, pp.1–23. -
R.G. Steadman, The Assessment of Sultriness. Part I: A Temperature-Humidity Index Based on Human Physiology and Clothing Science, Journal of Applied Meteorology and Climatology, 18(7), 1979, pp.861-873.
[https://doi.org/10.1175/1520-0450(1979)018<0861:TAOSPI>2.0.CO;2]

-
M. Morsy, G. El Afandi, Decadal changes of heatwave aspects and heat index over Egypt, Theoretical and Applied Climatology, 146, 2021, pp.71-90.
[https://doi.org/10.1007/s00704-021-03721-x]

-
박종길, 정우식, 김은별, 대기환경 : 열파 기준 설정 및 지역별 발생특성, 한국환경과학회:학술대회논문집, 2006, pp.68-70.
J.G. Park, U.S. Jeong, E.B. Kim, Heatwave criteria settings and occurrence characteristics by region, Proceedings of the Korean Environmental Sciences Society Conference, 2006, pp.68-70. -
이수지 외 9인, 기후변화 대응을 위한 RCP 시나리오 기반 국내 열지수와 불쾌지수 예측, 대기, 제23권 제2호, 2013, pp.221-229.
S.G. Lee et al., Future Prediction of Heat and Discomfort Indices based on two RCP Scenarios, Atmosphere, 23(2), 2013, pp.221-229. [https://doi.org/10.14191/Atmos.2013.23.2.221]
-
최별규 외 3인, 날씨 정보와 빅데이터를 활용한 개인 맞춤 의류추천서비스 설계 및 구현, 한국정보처리학회:학술대회논문집, 2020, pp.37–40.
B.K. Choi et al., Personalized Clothing Recommendation Service Using Weather Information and Big Data, Proceedings of the Korea Information Processing Society Conference, 2020, pp.37–40. -
D. Phung et al., Ambient temperature and risk of cardiovascular hospitalization: An updated systematic review and meta-analysis, Science of the Total Environment, 550, 2016, pp.1084-1102.
[https://doi.org/10.1016/j.scitotenv.2016.01.154]

-
W. Dong et al., Impact of heat wave definitions on the added effect of heat waves on cardiovascular mortality in Beijing, China, International journal of environmental research and public health, 13(9), 2016, 933.
[https://doi.org/10.3390/ijerph13090933]

-
임연희, 폭염이 건강에 미치는 영향, 보건복지포럼, 269(0), 2019, pp.7-19.
Y.H. Lim, The Health Effects of Heat Waves, Health and welfare policy forum, 269(0), 2019, pp.7-19. -
T. L. Delworth, J. D. Mahlman, T. R. Knutson, Changes in heat index associated with CO2-induced global warming, Climatic Change, 43(2), 1999, pp.369-386.
[https://doi.org/10.1023/A:1005463917086]

- M. Zahid, G. Rasul, Rise in summer heat index over Pakistan. Pakistan Journal of Meteorology, 6(12), 2010, pp.85-96.
- M. A. Rajib et al., Increase of heat index over Bangladesh: impact of climate change. World Academy of Science, Engineering and Technology, 58, 2011, pp.402-405.
-
S. Opitz-Stapleton et al., Heat index trends and climate change implications for occupational heat exposure in Da Nang, Vietnam. Climate Services, 2, 2016, pp.41-51.
[https://doi.org/10.1016/j.cliser.2016.08.001]

-
조혜민, 하재현, 이수기, 도시열섬현상과 사회적 취약계층의 공간적 분포 특성분석, 한국도시행정학회 논문지, 2015, pp.129–148.
H.M. Cho, J.H. Ha, S.G. Lee, An Analysis of Urban Heat Island Effect and Spatial Distribution of the Socially Vulnerable Class in Seoul, Korea. Journal of Korean Urban Management Association, 2015, pp.129–148. -
조혜민, 하재현, 이수기, 서울시 도시열섬현상과 지역의 물리적 환경과 인구 및 사회경제적 특성 탐색, 한국지역학회 논문지, 제35권 제4호, 2019, pp.61–73.
H.M. Cho, J.H. Ha, S.G. Lee, Exploring Physical Environments, Demographic and Socioeconomic Characteristics of Urban Heat Island Effect Areas in Seoul, Korea. Journal of Korean Regional Science Association, 35(4), 2019, pp.61–73. -
J. A. López-Bueno et al., Analysis of vulnerability to heat in rural and urban areas in Spain: What factors explain Heat's geographic behavior?. Environmental Research, 2021.
[https://doi.org/10.1016/j.envres.2021.112213]

