An Analytical Study on Indoor Thermal Comfort Performance According to the Automatic Control of Internal-External Blind
The purpose of this study is to analyse PMV (Predicted Mean Vote) and PPD (Predicted Percentage of dissatisfied) by automatic control of slat-type vertical blind. EnergyPlus, a building energy analysis software has been used for this study. The energy model is calibrated in Energy Plus using measured zone temperature and glass surface temperature data for one day and thermal comfort performance inside the building analysis was carried out. The calibrated data has the MBE of 4% and Cv(RMSE) of 10%. The result was that, for better zone thermal comfort, installation of blind on the outside is more appropriate than inside or no blind case. Additionally, different glazing types were compared and it was found that Triple Low-e glass is the most favorable.
Keywords:
Slat-Type Blind, PMV, PPD, MRT, EnergyPlus1. Introduction
1.1. Background and Objective of the Study
As the standard of living improves, Indoor thermal comfort pursued by the occupants of residential buildings and business facilities has qualitatively kept advancing. Also, estimation and analysis have been carried out through survey experiments to understand the thermal comfort for indoor occupants and, as a indicator of thermal environment; Predicted Mean Vote (PMV) has been employed. PMV is a quantitative indicator for the reaction of indoor occupants to thermal environment and theoretically expresses thermal comfort felt by occupants, considering comprehensively its factors, which are divided into objective thermal factors such as dry bulb temperature, relative humidity, air velocity, and Mean Radiant Temperature (MRT) and into subjective thermal elements including amount of clothing (Clo) and metabolic rate (Met). The studies carried out on thermal comfort to date mainly focus either on a plan to improve building energy or thermal environment inside a building through controlling factors related to thermal comfort or on the correlation of the sub-factors related to the indicators to thermal comfort. Lee Yong Jun et al. analyzed the thermal environment of a room adjacent to outdoor unit of air conditioner of a high-rise apartment house. They examined the change of PMV and PPD when applying previous cases and alternatives and analyzed the improvement of (Clo) according to the change [13]. Taking indoor radiation into account, Kim Se Hyun et al. proposed the performance assessment of thermal comfort and analyzed the factors with which PMV is calculated[14]. Mo Paek Hyoun et al. conducted a comparative study of the characteristics of thermal comfort and energy consumption in PMV control space with existing space of which temperature is controlled [15]. Noh Kwang Chul et al. performed a comparative analysis of the thermal comfort evaluation index of PMV and EDT in a lecture room equipped with 4-way cassette air-conditioner [16]. Most of previous studies regarding the performance of thermal environment with blinds installed limited their analytic interest to indoor air temperature [17][18][19][20]. Jeong Woo Ram et al. analyzed the impact of roller blinds on the thermal environment for the occupants by setting transmittance rate of blind at 10% when roller blinds are installed in an office building and taking reflectance as variable. The study drew a conclusion that installing roller blinds could lower PMV value by 1.3 on average, which presents more favorable thermal environment for indoor occupants during summer [21]. In an office space in which most of occupants' schedules are concentrated on daytime, pleasant indoor environment increases emotional satisfaction and work efficiency. Most of office buildings prefer curtain walls made of full glass due to the external aesthetics of a building and visual connection to outdoors with indoor occupants. As the structure of a curtain wall requires a broad space for window area, excessive direct solar radiation through windows can cause visual and environmental discomfort to indoor occupants. Although windows and their fittings of high-performance and high air-tightness have been developed, it is required to develop additional sunshade system that can reduce increasing consumption of cooling energy and solve thermal discomfort for indoor occupants. A blind, which is a commonly used shading device for an office building, can be divided into external and internal blind by the location of installation. Internal blinds are easy to operate and maintain, but less efficient in terms of thermal environment[11].
To date, many studies have been conducted on the changes of indoor light environment by the installation of blinds through actual survey and simulation and on the performance assessment of building energy and thermal environment. However, no studies have ever been attempted to analyze the performance of indoor thermal comfort when automatic controlling blinds are installed indoors. In this respect, the present study executed an analysis of indoor thermal comfort performance by automatic controlling of external blinds and type of window.
1.2. Research Method and Scope
This study followed the research procedure as shown in Figure 1. For this research, the mock-up test units that had been installed on the top of six-story building of domestic H University was employed and modeling was designed with simulation program EnergyPlus v6.0[11]. To set the conditions of automatic controlling of slat-type blinds, this study employed vertical control strategy[12], which is suggested in the study of Oh Myung Hwan et al., and decided to automatically control slat angle to a normal surface of solar radiation[11]. For vertical control strategy, this study determined to control the blinds, focusing on Discomfort Glare Index (GDI). Since DGI is satisfied within the scope of comfort with visual environment in case that vertical surface insolation is less than 50W /m2, the blinds were controlled to roll up to take in entire insolation. On the contrary, when vertical surface insolation is more than 50W /m2, the blinds were controlled to roll down. No installation of blinds were taken as a base model and compared with each case of internal and external installation of blinds for analysis. In addition, windows were replaced with different types to analyze the difference of thermal comfort performance and an optimal type of window was found.

Research flow chart
2. Criteria of Indoor Thermal Environment Performance
2.1. PMV (Predicted Mean Vote)
PMV is a mean value of subjective evaluation within a random group in a given environment. It comprehensively considers human body's metabolic rate, thermal resistance of clothing, dry bulb temperature, and average radiation temperature, air flow, humidity and others. PMV calculation method[2] suggested by P.O. Fanger in 1984 was adopted and established as ISO international standard[1]. In the analysis of EnergyPlus v6.0, P.O. Fanger's PMV calculation method was used. PMV equation is shown below.
PMV = (0.303e-0.036M+0.28)
×[(M – W) – H – EC – Cres – Eres]
Here, M: body's metabolic rate
W: Work performed outside
H : Heat loss through sensible heating
EC : Convective heat transfer through skin
Cres : Convective heat transfer through respiration
Eres : Evaporation heat transfer through respiration
Based on the above expression, thermally neutral state is set to ±0 as shown in Table 1 and 7-phase numerical scales from -3 (cold) to +3 (hot) are expressed in PMV index. ISO Standard 7730 recommends PMV comfort range to be between -0.5 <PMV <+0.5.

PMV index
2.2. PPD (Predicted Percent Dissatisfaction)
PPD is an index to predict how many people feel dissatisfied with given thermal environment. ISO Standard 7730 recommends PPD<10% as comfortable PPD range. PPD calculation is expressed as below.
PPD = 100 – 99e-0.03353PMV4+0.2179PMV2)
Here, e: natural constants (exponential constant)
3. Selection of Simulation Program and Setting of Analysis Conditions
3.1. Selection of Simulation Program
In this paper, EnergyPlus v6.0, developed by U.S. Department of Energy (The US DOE), was chosen as building energy analysis program[3]. The program dynamically interprets building energy and combines the merits of previously developed simulation programs, DOE-2 and BLAST. In addition, Heat Balance Method, which is recommended by ASHRAE, was adopted for the analysis of building load[4]. The optical analysis of blind modules was based on Simmler's model[5]. Using EnergyPlus, the present study quantitatively measured and analyzed indoor insolation radiated through windows equipped with slat-type blinds on the basis of "solar radiation transmitted through slat-type blinds", which was published in 1996 by Simmler, Fischer and Winkelmann. The following hypotheses were made for the theoretical analysis of slat-type blinds.
1) Slat is horizontal. Therefore, sunlight is completely diffused on arrival at the slat.
2) In determining optical characteristics, internal reflection in the space between the slat and glass is ignored. That is, they are replaced with the interpretations of the representative optical characteristics of blinds, which are decided by the penetration rate, reflectance, thickness and angle of a slat, and those of glass.
3) Small holes made for wires to support slats with are ignored.
Heat transfer between blinds and windows through natural convection is calculated by ISO 15099 standard formula, reflecting the shapes of intermediate space[6].
3.2. Simulation Modeling and Model Validation
Simulation modeling using Energy Plus is shown in Figure 2.
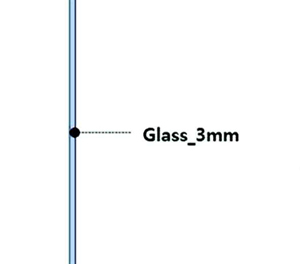
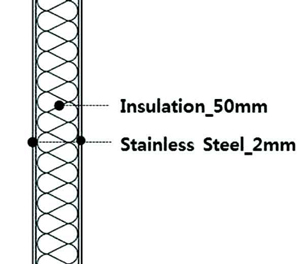
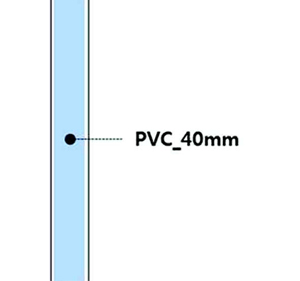
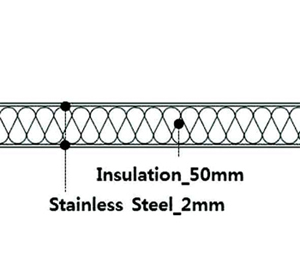
The simulated model has the same shape of the actual model and the physical properties of the model consisted of insulation and PVC in compliance with ISO 10456 (2005). The performance of internal/external slat-type blinds applied in the simulated model is shown in Table 2 and more specific information of each part of the model is explained in Table 3 below.

Simulated model[11]
Standard of simulated blind
Sectional details of each part[11]
The comparison of glass performance, which was changed, is shown in Table 4. The physical properties of glass (A and J manufacture) were used for this study.
To compare the performance of glazing
MBE (Mean Bias Error), which was the analytic tool used by Yoon Yeo Beom et al. that measured the difference between actual model and simulated model in internal air temperature and internal surface temperature of glass when blinds are installed internally (indoor blinds) and externally (outdoor blinds) with slat angle at 90° (vertical) and 0° (horizontal), was employed to compare and test the validity of the simulation model[11]. In addition, due to the limitation of MBE, Cv (RMSE) was applied for verification. It turned out that error rate of MBE and Cv (RMSE) is less than 4% & 10%, respectively[11]. Because the error rates of MBE and Cv (RMSE) were less than 10% and 30%, respectively, the reliability of the simulation model was demonstrated[7]. Therefore, the verified model was applied to the analysis of thermal comfort performance by presence and absence of a blind and the type of window.
3.3. Setting of Interpretation Conditions
It is recommended in EnergyPlus that if climate data of a certain area is unavailable, weather data from Meteonorm in format of TMY2 be used[8]. Accordingly, this study used the data derived from Meteonorm. In addition, the data for heat density of indoor lighting, indoor heating equipment and indoor set temperature as those of a standard office building, which are suggested in the performance expansion project of the Korea Institute of Energy Research, as seen in Table 5 is input for this simulation model[10].
Input conditions of internal heat gain and indoor set-point
In this study, an attempt was made to examine the pattern of thermal environment performance in an office building on the basis of the verified model described above. To do so, a hallway was added on the northern space, which is not air-conditioned. And thermal comfort performance was measured by indoor location and the results are shown in Figure 3. For the values that the present study wants to analyze, Energyplus shows only the result values of a central space to be analyzed which is not sufficient for this study. Therefore, the space was segmented into 14 sub-spaces for more accurate analysis. And the walls between spaces were virtually installed with infrared transparent walls through which daylight can penetrate.

Analysis of the target position of interior space
4. Simulation Results and Analysis
4.1. PMV and PPD Analysis
Indoor PMV and PPD were measured at 13:00 on a typical day of summer season (July 26) and winter season (Jan 10) in 3 cases: no blinds were installed, internal blinds were installed, and external blinds were installed, and by the type of window. At the time of measurement, solar elevation angle on the representative date of summer season was 72.96°and that on winter season was 31.55 °.

PMV analysis(July 26th 1PM)

PPD analysis(July 26th 1PM)

PMV analysis(Jan 10th 1PM)

PPD analysis(Jan 10th 1PM)
For PMV analysis, ASHRAE recommends that amount of clothing is 0.5Clo during cooling period and during heating period is 1.0Clo[9]. And metabolic rate was set at 1.15Met while airflow velocity was set to 0.2m/s. It turned out that the thermal comfort performance of all of windows was satisfied in the entire space when external blinds were installed during the representative day of summer season. In the case that internal blinds were installed, thermal comfort performance of all the windows, except Triple Low-e, did not satisfy in Area 1 but was satisfied in the rest areas. Only, Triple Low-e window satisfied thermal comfort performance in the entire space. When blinds themselves were not installed, all of the windows deviated from the thermal comfort range. In the case that external blinds were installed on the representative day of winter season, it turned out that Double Clear deviated from thermal comfort range in Area 1, 12 and 14; Triple Clear didn't stay within the range in Area 2 and 14; Double Low-e and Triple Low-e went beyond thermal comfort range in Area 14. When internal blinds were installed on the representative day of winter season, Double Clear and Triple Clear couldn't meet the scope of thermal comfort in Area 1, 2, 3 and 14 while Double Low-e and Triple Low-e deviated from the scope in Area 1, 2 and 14. At this time, all the windows except Triple Low-e had PMV +3 and PPD 100% in Area 1 and 2. When blinds were not installed and both internal and external blinds were installed, entire windows turned out to deviate away from thermal comfort range in Area 14, which was close to the hallway.
4.2. Correlation Analysis with Analysis Influencing Factors
A test was carried out to know the correlation between indoor air temperature, MRT, heat gain and loss through wall and solar radiation gain and loss through window, and PMV and PPD.

Indoor air temperature and the temperature of the corridor space analysis(July 26th 1PM)

Indoor air temperature and the temperature of the corridor space analysis(Jan 10th 1PM)

MRT analysis(July 26th 1PM)

MRT analysis(Jan 10th 1PM)
When indoor air temperature was compared with PMV, there was temperature gap of about by 1.5~1.6℃ in Area 14 and the hallway at 13:00 on the representative day of summer season and 14.8~15.0℃ at the same time on the representative day of winter season. It was confirmed that the gap (ΔT) was relatively greater between Area 14 and the hallway space on the representative day of winter season than summer season because the amount of heat loss (Q) in the wall between hallway and Area 14 is relatively greater on the representative day of winter season than summer season, as shown in Figure 12-14. As a result, it had impact on PMV, PPD and MRT of Area 14 adjacent to the hallway. In addition, it was found that when blinds were not installed and internal blinds were installed at 13:00 on the representative day of winter season, the gap of temperature in the areas near the windows was greater. When compared with external blinds installed, heat loss through wall had greater impact on PMV, PPD and MRT. However, the gap of temperature between external space and the areas near the windows and heat loss through wall were less at 13:00 on the representative day of summer season than at the same time on the representative day of winter season. As a result, PMV and PPD and MRT turned out less affected at 13:00 on the representative day of summer season than at the same time on the representative day of winter season.

Opaque surface inside face conduction gain(July 26th 1PM)

Opaque surface inside face conduction loss(July 26th 1PM)

Opaque surface inside face conduction loss(Jan 10th 1PM)
When heat gain through window was compared by type of window, Double Clear had the maximum gain and followed by Triple Clear, Double Low-e and Triple Low-e in this order at 13:00 on both representative day of summer and winter season. When heat gain through window was compared by the installation location of blinds and presence/absence of blinds, the least heat gain was in case of the installation of external blinds at 13:00 on both representative day of summer and winter season while the most heat was acquired in case of no installation of blinds at the same time on the representative day of both seasons as above. Only in the case that external blinds were installed, there was no heat gain at 13:00 on the representative day of winter season. As for heat loss through window, no windows lost heat at 13:00 on the representative day of summer season while Double Clear lost the most heat and followed by Triple Clear, Double Low-e and Triple Low-e at 13:00 on the representative day of winter season when external blinds were installed. Furthermore, Area 1 through 4 showed higher level of indoor thermal comfort performance at 13:00 on the representative day of summer season while Area 1 through 7 were more thermally comfortable at 13:00 on the representative day of winter season than any other areas due to heat gain through window, as shown in Figure 15 and 16, respectively. The reason why high values of PMV, PPD, MRT and indoor air temperature stretched farther from the windows at 13:00 on the representative day of winter season than summer season is that solar elevation angle at 13:00 on the representative day of winter season was 31.55°, which is lower than 72.96° at 13:00 on the representative day of summer season, so the penetration of sunlight in the space was deeper at 13:00 on the representative day of winter season than at the same time on the representative day of summer season.

Window heat gain & loss(July 26th 1PM)

Window heat gain & loss(Jan 10th 1PM)
5. Conclusion
In the simulation model, this study included internal and external slat-typed blinds, with automatically control the angles of the slat to a normal surface of solar radiation including no installation; various types of windows, and the space was fragmented into 14 sub-areas to compare the thermal comfort performance by location. The results of the study are summarized as follows.
1) When thermal comfort performance was compared among the cases of installation (internal and external) and non-installation of slat-type blinds, it was confirmed that external blinds has the highest thermal comfort performance at 13:00 on the representative days of both summer and winter season. On the contrary, no installation of blinds showed opposite results at 13:00 on the representative days of both summer and winter season. By type of window, it was demonstrated that the application of Triple Low-e has the highest performance of thermal comfort.
2) In the areas near the windows, Area 1 through 4 at 13:00 on the representative day of summer season, when solar elevation angle is high, and Area 1 through 7 at 13:00 on the representative day of winter season, when solar elevation angle is low, showed higher level of PMV, PPD, MRT and indoor air temperature than any other areas due to heat gain through window. In addition, PMV, PPD, MRT and indoor air temperature turned out higher when internal blinds or no blinds were installed than when external blinds were installed, due to greater heat gain through windows.
3) It was found that PMV deviated away from thermal comfort range in Area 14, which is near to the hallway, at 13:00 on the representative day of winter season. The deviation can be explained by the assumption that the heat loss through the wall increased due to the temperature gap between the hallway and Area 14. In addition, there was a considerable gap of internal and external temperature in the areas near the windows when no blinds were installed and when internal blinds were installed at 13:00 on the representative day of winter season. When it was compared with the case external blinds were installed, the former experienced relatively greater loss of heat through the wall, so PMV, PPD and MRT were more affected.
Acknowledgments
This research was supported by a grant (No.2012T100100065) from the Korea Institute of Energy Technology Evaluation and Planing (KETEP) funded by the Ministry of Knowledge Economy of the Korean Government.
References
- ISO Standard 7730, (2005).
- P.O Fanger, Thermal Comfort, McGraw-Hill Book CO, (1970).
- The U.S. DOE, EnergyPlus Input Output Reference, The Encyclopedic Reference to EnergyPlus Input and Output, (2011).
- F Winkelmann, Modeling Windows in EnergyPlus, Building simulation 2011 in : 7th international IBPSA Conference, (2011), 9.
- The U.S. DOE, EnergyPlus Engineering Reference, (2011).
- ISO 15099, Thermal Performance of Windows, Doors, and Shading Devices-Detailed Calculations, International Organization for Standardization, (2003).
- The U.S. DOE, M&V guidelines, Measurement and verification for federal energy projects version 3.0, (2008).
- The U.S. DOE, Lawrence Berkeley National Laboratory, Tips &Tricks for Using EnergyPlus, (2012).
- ANSI/ASHRAE Standard 55-2010, Thermal Environmental Conditions for Human Occupancy, (2010).
- Korea Institute of Energy Research, Result spread of energy business, (2007).
- Yeo Beom Yoon, Dong Su Kim, Kwang Ho Lee, A study on the building energy performance depending on the blind location, blind operation and glazing type, Architectural Institute of Korea, (2013).
- Myung Hwan Oh, Kwang Ho Lee, Jong Ho Yoon, Automated Control Strategies of Inside Slat-type Blind Considering Visual Comfort and Building Energy Performance, Energy and Buildings, (2012).
- Yong Jun Lee, Jee Woong Shin, Yun Gyu Lee, Kyung Hoi Lee, The methods to improve thermal environment of a room adjacent to an external unit room for high-rise apartment buildings, Korea Institute of Ecological Architecture and Environment, (2005).
- Se Hyun Kim, Kwang Chul Noh, Myung Do Oh, Study on the evaluation method of thermal comfort in consideration of the indoor radiation load, The Society of Air-conditioning and Refrigerating Engineers of Korea, (2003).
- Paek Hyoun Mo, Dong Hwa Kang, Dong Hee Choi, Jong Myung Sun, Myoung Souk Yeo, Kwang Woo Kim, Study on thermal comfort and energy consumption characteristic in PMV controlled space, Korean Institute of Architectural Sustainable Environment and Building Systems, (2008).
- Kwang Chul Noh, Myung Do Oh, Comparison of thermal comfort performance indices for cooling loads in the lecture room, The Korean Society of Mechanical Engineers, (2005).
-
Deuk Soo Hwang, Kyung Hee Lee, A study on the change of indoor thermal environment according to the location of blinds, The Korean Solar Energy Society, (2011).
[https://doi.org/10.7836/kses.2011.31.5.113]

- Yeo Beom Yoon, Kwang Ho Lee, An experimental study on the indoor environment assessment under the automated exterior blind operation, Architectural Institute of Korea, (2013).
- Kap Chun Yoon, Kang Soo Kim, An evaluation of energy performance in an office with venetian blinds in summer, Architectural Institute of Korea, (2012).
-
Dong Kyun Kim, Kap Chun Yoon, Jae Sik Kang, Kang Soo Kim, An experimental study on indoor thermal characteristics in accordance with the use of windows and blinds in double skin facade in summer, The Korean Solar Energy Society, (2011).
[https://doi.org/10.7836/kses.2011.31.1.059]
- Woo Ram Jeong, Myung Hwan Oh, Kwang Ho Lee, Jong Ho Yoon, Evaluation of thermal environment by installing the indoor roll blind in the office building, Korean Institute of Architectural Sustainable Environment and Building Systems, (2012).