
Impact by Estimation Error of Hourly Horizontal Global Solar Radiation Models on Building Energy Performance Analysis
Impact by estimation error of hourly horizontal global solar radiation in a weather file on building energy performance was investigated in this study. There are a number of weather parameters in a given weather file, such as dry-bulb, wet-bulb, dew-point temperatures; wind speed and direction; station pressure; and solar radiation. Most of them except for solar radiation can be easily obtained from weather stations located on the sites worldwide. However, most weather stations, also including the ones in South Korea, do not measure solar radiation because the measuring equipment for solar radiation is expensive and difficult to maintain. For this reason, many researchers have studied solar radiation estimation models and suggested to apply them to predict solar radiation for different weather stations in South Korea, where the solar radiation is not measured. However, only a few studies have been conducted to identify the impact caused by estimation errors of various solar radiation models on building energy performance analysis. Therefore, four different weather files using different horizontal global solar radiation data, one using measured global solar radiation, and the other three using estimated global solar radiation models, which are Cloud-cover Radiation Model (CRM), Zhang and Huang Model (ZHM), and Meteorological Radiation Model (MRM) were packed into TRY formatted weather files in this study. These were then used for office building energy simulations to compare their energy consumptions, and the results showed that there were differences in the energy consumptions due to these four different solar radiation data. Additionally, it was found that using hourly solar radiation from the estimation models, which had a similar hourly tendency with the hourly measured solar radiation, was the most important key for precise building energy simulation analysis rather than using the solar models that had the best of the monthly or yearly statistical indices.
Keywords:
Horizontal global solar radiation, CRM (Cloud-cover Radiation Model), ZHM (Zhang and Huang Model), MRM (Meteorological Radiation Model), Estimation of solar radiation, Weather file, Analysis of building energy performance, Building energy simulation program, DOE-2.2/eQUEST1. Introduction
The precise building energy performance analysis using a building energy simulation program requires accurate input data such as information of building envelope and HVAC systems of a building as well as an appropriate weather file. The appropriate weather file means the file contains highly reliable data of weather information that has been measured for a long-term at the building located. In general, it is an hourly weather data file, including data of general meteorological parameters such as dry-bulb temperature, wet-bulb temperature, dew-point temperature, wind direction, wind speed, atmospheric pressure, cloudiness, precipitation and sunshine duration as well as actually measured solar radiation or estimated solar radiation from the measured data. Most of building energy simulation program requires at least two radiation data from the followings: horizontal global solar radiation, horizontal diffuse solar radiation and normal direct solar radiation data. In South Korea, the general meteorological information can be obtained from the “Meteorological Agency (http://www.kma.go.kr/)” website that provides measured hourly weather information from 92 manned weather stations located all over the nation. However, only 22 weather stations1), including big cities such as Seoul, Busan, Daegu and Kwangju measure horizontal global solar radiation data. For solar radiation data for the other regions, horizontal global solar radiation and normal direct solar radiation data which derived from reliable solar radiation estimation models have been used.
- Nomenclature -
Ig Horizontal Global Solar Radiation (Wh/m2)
Ib Horizontal Direct Solar Radiation (Wh/m2)
Id Horizontal Diffuse Solar Radiation (Wh/m2)
Ie Extraterrestrail Nornal Direct Solar Radiation (Wh/m2)
Io Solar Constant (1,367 Wh/m2)
kT Hourly Clearness Index (I/Io)
n Nth Day of the Year (n/365)
Φ Latitude (Degree)
δ Solar Declination (Degree)
ω Hour Angle (Degree)
f(tn) Time Step to Fill
f(t1),f(t2) The Value around the Missing Time Step
f(tn-d)vv The Offset Back to the Previous Valid Day
In the previous study2) that the authors recently conducted to improve the accuracy of the hourly horizontal global solar radiation model in the Busan area, three estimation models that have been most commonly used and acknowledged with their reliabilities and accuracies in the United States were selected, and their estimated solar radiation data were compared with the data from the measured horizontal global solar radiation using the CMP 21 Pyranometer at the Busan weather station. From the result of the comparative analysis, it was found that developing a new hybrid solar estimation model that reflects seasonal characteristics is needed, and it can enhance a reliability of estimated solar radiation to a great extent. Additionally, it was expected to enable more accurate energy performance analysis of a building located in the area of which horizontal global solar radiation is not measured. However, it has not been studied enough yet for what amount of the data errors of weather files created by the estimation solar models have influenced on a computer-based building energy performance analysis.
Therefore, this study aims to identify actual impact of the errors derived from the three solar estimation models on building energy performance analysis. To conduct this, four different weather data files were packed using the four different horizontal global solar radiation derived from the measured and three different solar estimation models. These three solar estimation models were selected from the 24 models proposed in the research report of the American Society of Heating, Refrigerating and Air-Conditioning Engineers, Inc. (ASHRAE)3).
Then, these weather files were used for running a series of building energy simulations to compare differences of the simulated energy consumption results caused by estimation errors in the calculation of solar radiation against the measured solar radiation data.
2. TRY Formatted Weather Files
2.1. Meteorological Parameters
The main purpose of this study is to identify the impact of estimation errors of horizontal global solar radiation models on the simulation results by the computer-based building energy performance analysis process. To prepare for the weather files usable for DOE-2.1e and DOE-2.2/ eQUEST simulation programs, the hourly weather data was packed as the TRY formatted weather files using the real data measured at the Busan weather station (25° north latitude, 35.1° east longitude, 69.6m altitude) in 2010.
Each TRY file contains general meteorological parameters such as dry-bulb temperature, wet-bulb temperature, dew-point temperature, wind speed, wind direction, atmospheric pressure as well as solar radiation data such as horizontal global solar radiation and normal direct solar radiation. Each weather file contains the same data for the meteorological parameters except for the four different horizontal global solar radiation data. The details for the calculations of the solar estimation models were explained in the previous study2). In addition, the normal direct solar radiation data was calculated using the measured horizontal global solar radiation and the Erbs’ equation4), and the acquired normal direct solar radiation data was contained to all the four TRY weather files.
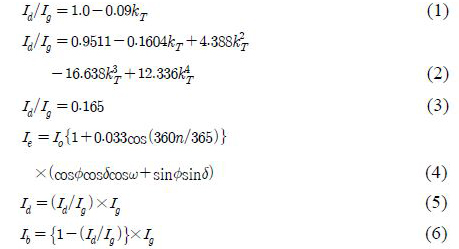
The following equations (1) to (6) show the Erbs’ equations for calculating normal direct solar radiation. The equation (1) is applicable when a clearness index (kT) is ≤ 0.22; equation (2) is applicable when it is 0.22< kT ≤0.8; and equation (3) is applicable when it is kT >0.8.
2.2. Horizontal Global Solar Radiation Models
For the comparative analysis, this study selected three horizontal global solar radiation models: Cloud-Cover Radiation Model (CRM), Zhang and Huang Model (ZHM) and Meteorological Radiation Model (MRM). The CRM and the ZHM are “regression type” models using local coefficients which are derived from the correlation between the measured solar radiation and local meteorological parameters in a specific area from the previous years. On the other hand, the MRM is a “mechanistic type” model using the meteorological data to calculate atmospheric constituents that cause absorption and scattering of the extraterrestrial radiation on the way to the surface on the Earth.
From the previous study2), it turned out that monthly horizontal global solar radiation was accurate in the order of the MRM, the ZHM and the CRM, while annual horizontal global solar radiation was accurate in the order of the ZHM, the MRM and the CRM. The details for the comparison results by hourly, monthly and yearly were described in the previous study2). Figure1 shows the comparison results of the monthly total global solar radiation from the three estimation models against the one from the measured.

Comparison plots between calculated monthly horizontal global solar radiation using CRM, ZHM and MRM against the measured radiation in Busan, Korea
2.3. Interpolation of Missing Meteorological Data
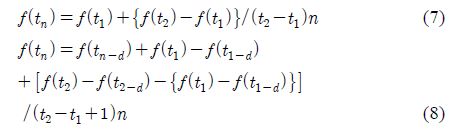
Hourly weather data measured at a weather station sometimes has missing data due to the measuring equipment problems. The missing data was interpolated by the method proposed by Long5) in this study. The following equations (7) and (8) are the interpolation equations. When the length of missing gaps (i.e., f(tn) was equal or less than 6 hours, f(tn)≤6, the missing data was filled-in by linear interpolation by equation (7), and when the length of missing gaps were larger than 6 hours and equal or less than 48 hours, the missing data was filled-in by taking the trend of the first previous day that is valid as seen in equation (8), 6<f(tn)≤48. These equations were only used for dry-bulb temperature, wet-bulb temperature, dew-point temperature and horizontal global solar radiation, and for atmospheric pressure, missing data was filled-in with last value previous to the gap. Additionally, missing data for the other weather parameters does not mentioned above (i.e., wind speed and wind direction) was left in “999” value.
2.4. Packing TRY Weather File
The weather data modified by the foregoing process were packed as the TRY (test Reference Year) formatted weather file by the method6) developed by the Lawrence Berkeley National Laboratory (LBNL), U.S.A. In order to produce a TRY weather file, DOE-2.1e program requires two input files, which are a TPE and an INP file. The TPE is an input file that contains all the weather parameters data mentioned before, and the INP is an another input file that contains a characteristic information such as year of the weather parameters measured, the identification number of weather station, latitude, longitude, monthly clearness index and so on for the specific area. In particular, the INP file requires monthly average clearness index measured at the site of weather station. In this study, the monthly average data was calculated from daily clearness index measured at the Busan weather station in 2010. The calculated monthly average clearness index are: 0.54 for January; 0.42 for February; 0.36 for March; 0.41 for April; 0.44 for May; 0.43 for June; 0.40 for July; 0.45 for August; 0.46 for September; 0.50 for October; 0.55 for November and 0.50 for December. Using these two input files, the TRY formatted weather file, which can be used for DOE-2.1e and DOE-2.2/eQUEST programs, were produced by running the DOE-2.1e program.
3. Building Energy Performance Analysis
3.1. Building Energy Simulation Program
In this study, the DOE-2.2/eQUEST program, which has been acknowledged as one of the best programs for decades in the field of building energy performance analysis, was used to model and simulate the office building in the Busan area. The input information for the building envelope is summarized in Table 1, and the HVAC systems is listed in Table 2. A 10-story of standard office building was modeled that has 2,323m2 of floor area in each level. The inputs in Tables 1 and 2 were set by the following criteria: Heat transfer for the building envelope such as exterior walls, roof, floors and windows were set to be compliant with "Design Standard Guideline for Building Energy Saving"7) proposed by the Korean Energy Management Corporation (KEMCO), and infiltration rates were set according to the values suggested by the U.S. Pacific Northwest National Laboratory (PNNL)8). In addition, the weekdays and weekends operation schedule proposed by the U.S. National Renewable Energy Laboratory (NREL)9) was applied to the model, including internal load, lighting and equipment power density, schedules for occupants, lighting, appliances, temperatures for heating and cooling systems, ventilation, and hot water heater. As seen from Figure2, the building shape is square, which does not have any specific direction to face, and its openings take evenly 28% in all directions of the building.
3.2. Comparison Results for Building Energy Performance Analysis
The four TRY weather files were used for running the DOE-2.2/QUEST program to simulate the four cases of the energy performance for the standard office building. After that, the simulation results were compared each other taking account of the relationship between the measured and the estimated horizontal global solar radiation.
Figure 3, 4, 5 and 6 show the simulated energy consumptions for the office building by four groups, which are monthly cooling, heating, weather-dependent (i.e., cooling, heating, fan, pump and hot water heater) and weather-independent energy consumptions (i.e., lighting and equipment), respectively using the four different weather files. As seen from Figure 3, 4 and 5, it turned out that the differences between the measured and each of the three estimated horizontal global solar radiation had a little impact on energy consumptions for cooling, heating and the weather-dependent. However, Figure 6 shows that it did not affect at all the weather-independent energy consumption.

Description on office building model
HVAC systems in office building model

Office building model by DOE-2.2/eQUEST
Table 3 shows a summary of cooling, heating and weather-dependent energy consumptions as well as the percentage differences that calculated from the differences of the energy consumptions between using the measured and the three estimated solar radiation models. In addition, it also shows the comparison results of global solar radiation between the measured and the three different estimation models. The highlighted areas in the table show the most accurate models in each category by month.
In the comparison results of horizontal global solar radiation, most of the monthly solar radiation estimated by the MRM was the closest to the measured solar radiation although the ZHM was the closest to the measured solar radiation during the spring and the fall seasons. However, the annual solar radiation estimated by the ZHM was the closest to the measured solar radiation despite its errors in monthly estimations.

Comparison of monthly electricity use for space cooling plotted against monthly horizontal global solar radiation (Measured, CRM, ZHM and MRM)

Comparison of monthly natural gas use for space heating plotted against monthly horizontal global solar radiation (Measured, CRM, ZHM and MRM)

Comparison of monthly weather-dependent energy use plotted against monthly horizontal global solar radiation (Measured, CRM, ZHM and MRM)

Comparison of monthly weather-independent energy use plotted against horizontal global solar radiation (Measured, CRM, ZHM and MRM)
Comparison between monthly measured and three estimated global solar radiation (CRM, ZHM and MRM), and corresponding monthly energy use of the office building by the three categories- electricity use, natural gas use and weather-dependent energy use (% indicates percentage difference, and highlighted cells indicate the most accurate model in each category)
The followings show the monthly simulated energy consumptions in each category (i.e., cooling, heating and weather-dependent energy consumption) considering the solar estimation errors between using the measured and the three different estimation models. For the cooling energy consumption, the simulated energy consumption using the CRM was the closest to the energy consumptions using the measured solar radiation within 1% to 2% errors over the whole year except for a few months in the summer season regardless of the large errors of the estimation in solar radiation. In the meantime, the MRM, which had the least estimation errors in solar radiation, rather shows considerable errors in the cooling energy consumption. In addition, the cooling energy consumption using the ZHMwas pretty close to the cooling energy consumption using the measured solar radiation during the summer season (i.e., July through September) when the cooling load increases the most. For the heating energy consumption, the simulated energy consumption using the MRM was the closest to the energy consumption using the measured solar radiation in –3% errors. On the other hand, the heating energy consumption using the ZHM showed considerable errors, over 30%, during the summer season.
The weather-dependent energy consumption is the most suitable category of energy consumption for a comprehensive evaluation of the impact of horizontal global solar radiation on the building energy consumption since this includes energy consumptions for fan and pump that used for the conditioning the space along with the cooling and heating energy consumption themselves. As a result of this comparison, the weather-dependent energy consumption using the ZHM was the closest to the energy consumptions using the measured solar radiation in the most of months (i.e., January, February, March, April, November and December), while the energy consumption using the CRM was the closest to the energy consumption using the measured solar radiation for the other months (i.e., June, July, August, September and October). In addition, it was shown that there was no considerable gap in annual energy consumptions between using the CRM and the ZHM.
From the comparative study of the impact of the estimation errors of horizontal global solar radiation on building energy performance simulation, the CRM and the ZHM were turned out to be the best models providing the most accurate cooling energy consumption, while the MRM calculates the most accurate global solar radiation as a whole. In addition, it was found that the ZHM was the most accurate model during the winter season, and the CRM was the most accurate model during the summer season for calculating the weather-dependent energy consumption when they were used for the simulation.
These analysis results are beyond the expectation since it was expected that there might be a correlation between the accuracy of the estimated solar radiation and the corresponding energy consumption. In order to identify the reason for these results, the other analysis was conducted using daily data rather than monthly data. However, it is difficult to analyze every single day for the whole year so that three days were selected from the four seasons (i.e., three days from January for the winter season, three days from April for the spring season, three days from July for the summer season, and three days from October for the fall season). The same analysis was conducted using the daily data instead of the monthly data.
Table 4 shows a summary of daily weather-dependent energy consumption as well as the percentage differences that calculated from the differences of the energy consumptions between using the measured and three estimated solar radiation models. In addition, it also shows the comparison results of daily global solar radiation between the measured and the three different estimation models. As seen from Table 4, the daily weather-dependent energy consumption using the most accurate solar radiation estimation models was the closest to the energy consumption using the measured solar radiation data as a whole, but for the spring season. The impact of the errors from the solar radiation estimation models on building energy performance was turned out to be more obvious in the summer season than the winter season. It can be explained that the impact of solar radiation on the building energy is greater for cooling than for heating.
Comparison between daily measured and three estimated global solar radiation (CRM, ZHM and MRM), and corresponding daily weather-dependent energy use of the office building for each three days of four seasons (% indicates percentage difference, and highlighted cells indicate the most accurate model for each day)
The reason for the different results from the monthly and daily analysis can be as following: Building energy simulation program calculates cooling and heating loads of a building from hourly ambient weather conditions (i.e., the TRY weather files in this study), and it calculates energy consumption for the building after deciding capacity of cooling and heating systems. Thus, the accuracy of hourly horizontal global solar radiation had impact on the calculations of the building energy consumption. In this respect, this experimental study shows that the accuracy of the estimated global solar radiation cannot be evaluated by the monthly or yearly statistical indices to use it for building energy simulation program.
4. Conclusion
This study analyzed the energy performance of the office building located in the Busan area using DOE-2.2/eQUEST program and the TRY weather files packed from the measured and the estimated horizontal global solar radiation by the three different models. As a result from the comparative analysis, it was demonstrated that the errors between the measured and the estimated solar radiation from the three estimation models had an impact on the office building energy performance analysis in a diverse way. Additionally, it was found that it was the most important for building energy performance analysis to use the solar radiation models that could precisely estimate the measured solar radiation by the hour rather than to use the models that had the best of monthly or yearly statistical indices.
The findings from this study is not enough to be generalized because this analysis is limited to the specific weather conditions in the specific area, and the results were derived from the limited-conditioned office building model. Therefore, following studies considering more diverse weather conditions are necessary to be done. However, it is the contribution of this study that this study demonstrated an application of a single selected solar radiation model can result in considerable errors in the building energy simulation. In addition, changes of solar heat gain coefficient or window-to-wall ratio of a building, which is deeply related parameters to solar radiation, can have a large impact on the building energy simulation results. Therefore, future study will be focused on identifying how these parameters affect the building energy performance analysis.
References
- K.H Lee, K.Y Sim, Analysis and calculation of global hourly solar irradiation based on sunshine duration for major cities in Korea, Journal of the Korean Solar Energy Society, (2010), 30(2), p16-21.
-
K Kim, K Oh, Comparison analysis of estimation models of hourly horizontal global solar radiation for Busan, Korea, Journal of the Korean Solar Energy Society, (2013), 33(1), p39-47.
[https://doi.org/10.7836/kses.2013.33.5.009]

- M Krarti, J Huang, D Seo, Development of Solar Radiation Models for Tropical Locations, ASHRAE Project RP-1309, American Society of Heating, Refrigerating and Air-Conditioning Engineers (ASHRAE), (2006).
-
J Duffie, W Beckman, Solar Engineering of Thermal Processes, 2nd Ed, John Wiley & Sons, Inc, (2006).
[https://doi.org/10.1115/1.2930068]
- N Long, Real-time Weather Data Access Guide, Report NREL/BR-550-34303, National Renewable Energy Laboratory (NREL), (2006).
- F Buhl, Weather Processor, Lawrence Berkeley National Laboratory (LBNL), (1999).
- KEMC, Design Standard Guideline for Building Energy Saving, Korean Energy Management Corporation (KEMC), (2011).
- K Gowri, D Winiarski, R Jarnagin, Infiltration Modeling Guidelines for Commercial Building Energy Analysis, Report PNNL-18898, Pacific Northwest National Laboratory (PNNL), (2009).
- M Deru, Energy Savings Modeling and Inspection Guidelines for Commercial Building Federal Tax Deductions, 2nd Ed, Technical Report NREL/TP-550-40467, National Renewable Energy Laboratory (NREL), (2007).