Calculation of Adequate Remodeling Period for The Improvement of Thermal Insulation Performance of External Walls in Deteriorated Apartments
ⓒCopyright Korea Institute of Ecological Architecture and Environment
Abstract
Under the purpose of presenting the adequate remodeling period for the improvement of thermal insulation performance of external walls in deteriorated buildings, the change in external wall and residential environment problem(dew condensation) due to aged deterioration after the apartments were constructed in Korea were analyzed.
Temperature Difference Ratio Outside(TDRo) and Heat Flow Meter(HFM) were used as measurement methods to evaluate the thermal insulation performance of deteriorated buildings. For TDR evaluation, thermo-graphic camera was used to measure and analyze the surface temperature of external wall. Also, dew condensation evaluation was analyzed using the Temperature Difference Ratio Inside(TDRi).
As a result of analyzing thermal performance through TDRo, the first decline point of thermal insulation performance began after 14-16 years have passed since construction was completed, and after 20 years have passed the decline point of thermal insulation performance reappeared. As a result of analyzing U-value with HFM measurement method, the decline rate of external wall’s thermal insulation performance is lower than 2% in average at around 5 years after completion, and 8.7% in average at 10-15 years, and over 10.2% in average at 20 years.
Keywords:
Apartment, Dew Condensation, Thermal Insulation Performance, U-value, Thermo-graphic camera키워드:
아파트, 결로, 단열성능, 열관류율, 열화상카메라1. Introduction
1.1. Research Background and Purpose
The insulation of the old apartment house was designed and constructed with remarkably low performance compared with the current insulation design standard, and as thermal insulation performance is further deteriorated due to aged deterioration after completion, the amount of heat that flows through the doors, windows, and walls increases, causing dew condensation, which leads to a problem of deteriorating the residential environment.
Recently, the government has introduced a design guideline 1) for prevention of dew condensation from May 2014 as the interest in the residential environment such as the comfort of the residential space and the health of the resident increases, and recently, a remodeling method is considered for securing the thermal insulation performance of the external walls with the aim of preventing the energy loss of the old buildings and improving the residential environment performance.
In this study, we analyzed the change trend of thermal insulation performance change of external walls according to aged deterioration after completion for apartments among domestic representative residential buildings. Also, by evaluating the typical residential environment problems (dew condensation) caused by thermal insulation performance change (deterioration) in parallel, it aims to propose a proper remodeling time for improving thermal insulation performance of exterior walls in old buildings
1.2. Research methods and scope
The thermal insulation performance for old buildings was evaluated by using measurement method of TDRo (Temperature Difference Ratio Outside) and Heat Flow Meter (hereinafter referred to as HFM). The TDR evaluation is the method of measuring the surface temperature of external walls through thermo-graphic camera, and comparing the difference with the indoor and outdoor temperature using the surface temperature. The HFM evaluation is the evaluation method that analyzes the amount of heat passing through the wall and can be derived from the quantitative U-Value of the insulation wall.
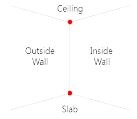
The condensate dew condensation performance was evaluated by TDRi, Temperature Difference Ratio Inside (hereinafter referred to as TDRi) proposed in the design standard for preventing the dew condensation. TDRi is the evaluation method for measuring the surface temperature through the thermo-graphic camera in the same way as the TDRo, but the measurement site is not the external walls, but the surface temperature of weak areas (wall junction, windows, doors) where dew condensation occurs in the room.
The subjects to be measured were selected as apartments with the same insulation wall structure, it was limited to the apartments in the central area with the same thermal insulation design standard (U-value) of the internal and external walls in the energy saving design standard,2) And to evaluate the insulation and dew condensation performance due to aged change, the scope of subjects to be measured was set as apartments in the new city where apartment development, planning and demand are most concentrated.
2. Outline of insulation and condensation performance analysis
2.1. Performance evaluation of insulation and dew condensation by thermo-graphic measurement
Performance of insulation and dew condensation by thermo-graphic measurement was evaluated by using the infrared ray method standard proposed in ISO 6781 and the formula of TDRo and TDRi of Equation 1. Thermal insulation performance (TDRo) is evaluated by the emissivity and reflection temperature of the surface finish material of the external walls and the indoor and outdoor temperatures during the measurement.
| (1) |
Here,
Ti : Room temperature ℃)
To : Outside temperature (℃)
Tis : Surface temperature of window and wall junction, internal wall (℃)
Tos : Surface temperature of external walls
The occurrence of indoor dew condensation (TDRi) was assessed for the vulnerable areas presented in the design guidelines for preventing dew condensation in apartment housing. Table 1 below shows the vulnerable areas of dew condensation and the minimum performance standard for the central region presented by the Ministry of Land, Infrastructure, and Transport.

The Performance Standards by Element
2.2. Thermal insulation performance evaluation of external walls through HFM measurement
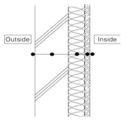
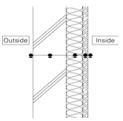
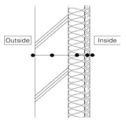
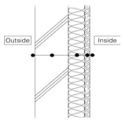
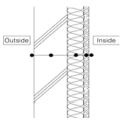
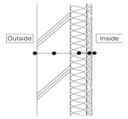
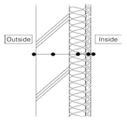
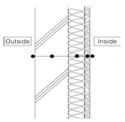
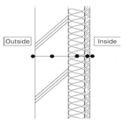
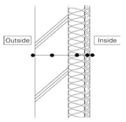
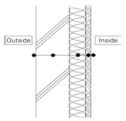
The HFM evaluation is carried out by installing the device measuring heat flow on the inner surface of the insulation wall facing directly to the open air and evaluating the U-value of the wall by analyzing the heat flowing through the wall. The measurement was performed according to the standard set out in ISO 9869. As U-value was derived from long-term useful data, in this study, U-value of each subjects to be measured was derived by measuring at intervals of 10 minutes for 120 hours.
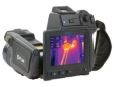
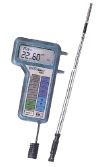
Table 2 below shows the specifications of the thermo-graphic camera used in this study and the heat flow measuring equipment for indoor and outdoor environment and HFM evaluation.
Specification of Measuring Equipment
3. Apartment insulation and dew condensation performance evaluation
3.1. Subjects to be measured and method
Domestic apartments represent the most development and demand centered on new cities. The development and planning of a new city began in the 1980s and is divided into first generation (late 1980s to mid 1990s) and second generation (late 2000s). In this study, apartments were selected as subjects to be measured in the new city constructed according to the planning year of two generations. And, additional 1.5 apartments were selected arbitrarily because the difference of the planning year of the two generations occurred, and the insulation and dew condensation performance of total 55 apartments were analyzed.
The trend of thermal insulation performance by aged year was analyzed by TDRo of external walls, and then, the representative unit home by generation of each new city was selected and the external walls U-Value was analyzed by HFM measurement method. In the representative unit home, accurate measurement was performed to determine whether indoor dew condensation occurred (TDRi). Table 3 shows the outline and classification of analysis objects selected under the above conditions
Classification of analysis objects
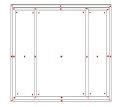
The external wall thermal insulation performance evaluation was performed on the sidewall structure that has the largest heat gain and heat loss and is directly facing the outside air. Through thermo-graphic before the measurement, areas where surface temperature is high or not homogeneous such as heat bridge areas, insulation materials leaks, other construction problems, external walls of non-heating spaces, etc. were excluded. Under the above conditions, the measurement was carried out in the winter when the temperature difference between indoor and outdoor is more than 10 ℃.
3.2. Trend analysis of thermal insulation performance of main external walls
Table 4 below shows the TDRo calculation results of external walls (sidewalls) by subject to be measured(55 apartments).
Analysis Result of Exterior Wall TDRo
The thermal insulation performance of the wall through TDRo is considered to be poorer as the thermal insulation performance converges to –1, conversely, as converges to 0, the thermal insulation performance is better. In the TDRo analysis of 55 measurement subjects analyzed in this study, TDRo represented the trend pattern of index type converging to –1 in proportion to the increasing number of years. Each measured subject to be measured does not show a proportional thermal insulation performance depending on the year of construction due to the influence of surrounding environment and the firmness of the insulation construction. However, after the completion, it is evaluated that it is different from initial performance of building as the years go by.
Analysis of distribution of TDRo by new city generation shows that the average TDRo of in the second new city is -0.084. This shows that the TDRo distribution values are 2.2 times (-0.181) and 2.8 times (-0.240) lower than the TDRo measurement results for the apartment building in the 1.5 and 1 generation new town.
The initial thermal insulation performance is different due to the difference of the insulation design value according to the legal insulation design standard of the completion year by analysis subject, but compared with the legal insulation design performance standard, the thermal insulation performance gradually deteriorae after completion in all subjects. Under a pattern in which index form thermal insulation performance deterioration occurs according to aged change, it is analyzed that the time point of deterioration of the primary insulation performance, in which the deterioration rate in thermal insulation performance slightly increases from 14 to 16 years after the completion of the construction (as of 2016), appears, and the deterioration point of the secondary insulation performance, in which the deterioration rate of thermal insulation performance increased again from the point that 20 years have passed after that.
3.3. HFM analysis of external walls of Unit Home
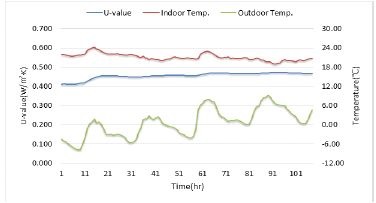
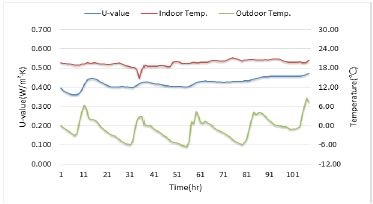
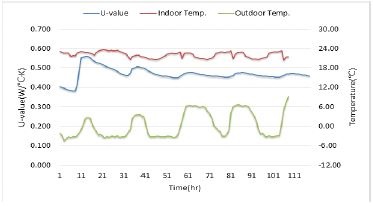
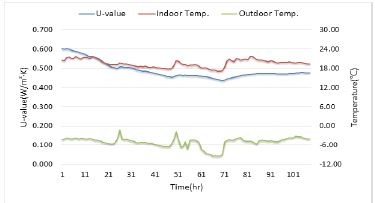
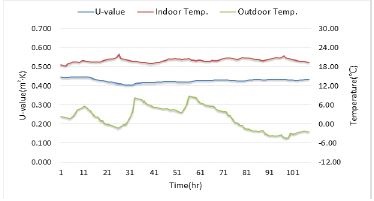
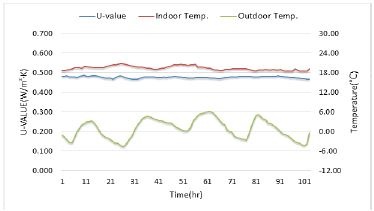
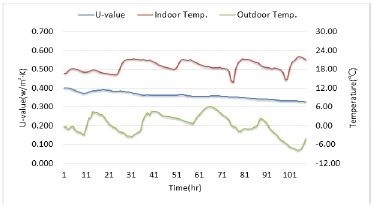
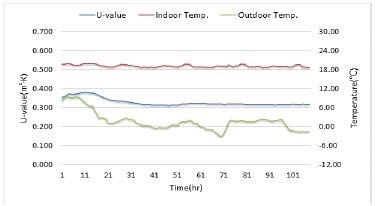
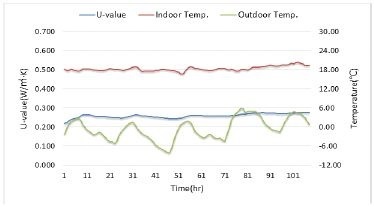
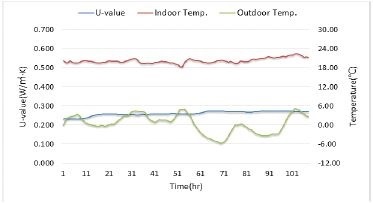
To verify the thermal insulation performance analysis (TDRo) and to quantitatively analyze deterioration rate of the thermal insulation performance in 55 apartments, we selected each typical Unit Home (Table 3) by generation new city of subjects to be measured and derived the U-value of the wall through the HFM measurement method. In order to obtain long - term useful data according to the characteristics of HFM measurement, we measured for 120 hours in this study. However, the measurement data of the first 12 hours after the installation of the measuring equipment was regarded as an unstable period of heat flow through the wall and excluded from the analysis. In this study, effective data for the U-value measurement of the wall heat transfer rate in this study is data measured for a total of 108 hours from 13 hours to 120 hours after the measurement. The following Table 5 and 6 show the analysis result of U-value through HFM measurement by measurement Unit Home, and Fig. 2 shows the result of comparing and analyzing the HFM measurement results compared with the initial thermal insulation performance planned and constructed of measurement unit home.
Result of Calculation & Measurement U-Value by Unit Home(Case_1 ~ 5)
Result of Calculation & Measurement U-Value by Unit Home(Case_1 ~ 5)

Analysis Result of The Variance Error of U-Value
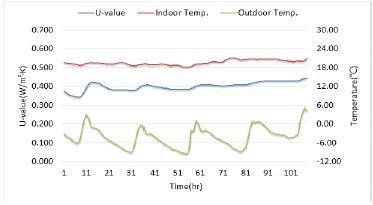
As a result of the analysis, the average U-value of HFM measured in the new city (Case_2, 7, 14, 19) apartment in the 1 generation new city passed an average of 20 years (as of 2016) was 0.475W/㎡·K, and the performance was found to be deteriorated by about 10.2% when compared with the U-value of the initial thermal insulation performance (average, 0.431W/㎡·K). In case of 1.5 generation new city (Case_21, 24, 25), which passed more than 15 years and less than 20 years after completion, the average U-value of HFM was 0.456W/㎡·K, and the performance was found to be deteriorated by about 7.7% when compared with the initial thermal insulation performance (average, 0.423W/㎡·K). In case of 2 generation new city (Case_42, 50, 51, 54, the average U-value of HFM was 0.310W/㎡·K, and the performance was analyzed to be deteriorated by about 4.6% when compared with the initial thermal insulation performance (average, 0.296W/㎡·K).
In contrast to the initial thermal insulation performance, the average deterioration rate of decrease was 4.6% in apartments passed less than 15 years after completion, and in Case_25 apartment where 15 years passed, a rapid deterioration rate of 11.8% compared with the initial thermal insulation performance appeared, which was evaluated as the deterioration point of the initial thermal insulation performance. Thermal insulation performance of apartments passed more than 16 years and less than 20 years showed average deterioration rate of 5.6% compared with the initial thermal insulation performance. However, in Case_19 apartment where 21 years passed, thermal insulation performance showed average deterioration rate of 13.3% compared with the initial thermal insulation performance, which was evaluated to show the deterioration point of secondary thermal insulation performance
As shown in Fig. 2, U-value analysis result of external walls by HFM measurement method showed a deterioration pattern of thermal insulation performance according to aged change similar to the result presented in the TDRo analysis
3.4. TDRi analysis by vulnerable site of dew condensation occurrence of Unit Home
In comparison with the TDRi calculation value by internal surface temperature measurement of the measurement unit home (11) and the minimum performance standard for preventing dew condensation, dew condensation occurrence by thermal insulation performance deterioration was analyzed. However, this study aimed to derive the timing of remodeling according to the change of insulation and dew condensation performance of external walls, so the dew condensation performance evaluation was performed to evaluate the occurrence of dew condensation of window and wall junction of the room where the side wall was located except the door. In Table 7, the surface temperature and the indoor and outdoor temperatures shown on the vulnerable areas of each dew condensation show the analysis results measured and averaged for 6 hours, and Figure 3 to 5 show the comparison and analysis results compared with the minimum performance standard.
Result of Surfcae Temperature & TDRi
As shown in Fig. 3, in the 1st generation new city apartment, it was analyzed that dew condensation occurred as most vulnerable areas appeared beyond the minimum performance standard (blue area). In particular, the corner area of window glass was 1.7 times (average 0.41) higher than the standard TDRi (0.22) value. And the apartments in the 1st generation new city, which were old apartments passed an average of 24 years, were evaluated that thermal insulation performance of the external walls was deteriorated greatly and dew condensation occurred in the wall joint at all households.

Comparison·analysis of 1st generation new city’s TDRi
As shown in Fig. 4, the apartments of the 1.5 generation new city was found to satisfy the minimum performance standard in the rest of vulnerable areas except for the wall junction. In case of more than 15 years after completion of construction, similar to TDRo and HFM analysis results with the high risk of dew condensation of more than 10% of performance deterioration compared to the standard (0.25) at wall junction, and average 16 years of age, the thermal insulation performance was evaluated to show characteristics that decrease rapidly

Comparison·analysis of 1.5 generation new city’s TDRi
As shown in Fig. 5, in the 2nd generation new city apartment, the rest of measurement home except for Case_42, were found to meet the minimum performance standard for preventing dew condensation. In Case_42, there was a high risk of dew condensation in the window, and TDRi of the wall junction which is directly related to the thermal insulation performance of external walls, was 0.2 higher than the minimum performance compared to standard (0.25), and it was evaluated that the risk of dew condensation was not high.

Comparison·analysis of 2nd generation new city’s TDRi
As a result of analyzing the thermal insulation performance deterioration due to aged change of Unit Home by new city and residential environment (dew condensation) performance caused by this, the risk (occurrence frequency) of dew condensation of wall junction and window was also high after 15 years or more after completion and again 20 years later that thermal insulation performance deterioration rate was markedly higher.
4. Conclusion
According to the results of analysis of thermal insulation performance and risk of occurrence of dew condensation in apartment external walls by aged change, the main results of this study suggesting the proper timing of remodeling external walls of old buildings are as follows.
As a result of evaluating the thermal insulation performance change trend of external walls by standard of TDRo analysis result, the thermal insulation performance shows the point at which thermal insulation performance deterioration rises primarily after about 14 to 16 years after completion with the initial (design) thermal insulation performance standard. On the other hand, Case_42, despite the apartment complex completed in 2008 (8 years of elapsed years) showed a deterioration rate similar to Case_25. It is determined that the error range of measurement results is considerably increased due to the solidity of the insulation construction, the wet condition of the wall, the influence of the surrounding environment, and the thermal insulation pattern of the residents. It was analyzed to show the second deterioration point that the thermal insulation performance rapidly deteriorated from the time that 20 years passed after that.
The tendency of deterioration of thermal insulation performance showed the similar characteristics in U-Value analysis result through HFM measurement method for typical unit home. Thermal insulation performance deterioration rate of external walls was less than 2% in 5 years of elapsed years after completion of the building, while thermal insulation performance of the external walls after 10 to 15 years elapsed showed the characteristics deteriorated by average 8.7% compared with the initial performance. And the thermal insulation performance of deteriorated apartment buildings over 20 years showed thermal insulation performance deteriorated more than average 10.2%.
In addition, in the point at which thermal insulation performance deterioration appears clearly, the point 15 years passed after completion and the point more that 20 years passed, the risk of dew condensation in wall junction and window frames was significantly high.
As the results of analysis of deterioration of thermal insulation performance and the occurrence of residential environment problem by aged change, it is considered that measures and systematic management are required to improve thermal insulation performance from the point at least 15 years passed after completion of the building, and the remodeling action should be performed to improve the thermal insulation performance substantially before the maximum 20 years passed after completion.
Acknowledgments
This study was conducted by support of Korean Research Foundation (NRF-2014R1A1A2059927) funded by government (Ministry of Education, Science and Technology).
Notes
References
- Choi, Gyeong-Seo, On-siteEvaluation forThermalPerformanceofBuilding Envelopesusing an InfraredMethod, Department of Architectural Engineering Graduate School, Hanyang University, (2010).
-
Choi, Bo-Hye, Kang, Jae-Sik, "The Thermal Performance of Building Insulation Materials According to Long-Term Aging, Korean Journal of Air-Conditioning and Refrigeration Engineering, Vol.25(No. 11), (2013).
[https://doi.org/10.6110/kjacr.2013.25.11.617]

- Park, Se-Young, A study on the improvement of the condensation prevention standards in residential buildings, Department of Convergence Engineering for Future City Sungkyunkwan University, (2014).
- Jeong, Chan-woul, Kim, Hyun-Soo, Jeong, Su-Hyeon, m, Young-Tak, Song, Doo-sam, Comparison and Analysis of Domestic and Foreign Standards for Preventing the Condensation in Multi-residential House, Korean Journal of Air-Conditioning and Refrigeration Engineering, (2013).
- PARK, Jung-Hun, An Analysis of Thermal Insulation and a Study of Application of Reinforced Insulation in Apartment Houses, Department of Architectural Material Graduate School of Kong-ju National University, (2014).
- Moore Patrick, O., "Nondestructive Testing Handbook : Infrared & Thermal Testing, American Society for Nondestructive Testing", (2001).
- Akira, Hoyano, Kohichi, Asano, Takehisa, Kanamaru, "Analysis of the sensible heat flux from the exterior surface of buildings using time sequential thermography", Atmospheric Environment, 33, (1999).